helium graph 2
Source: Edison Investment Research
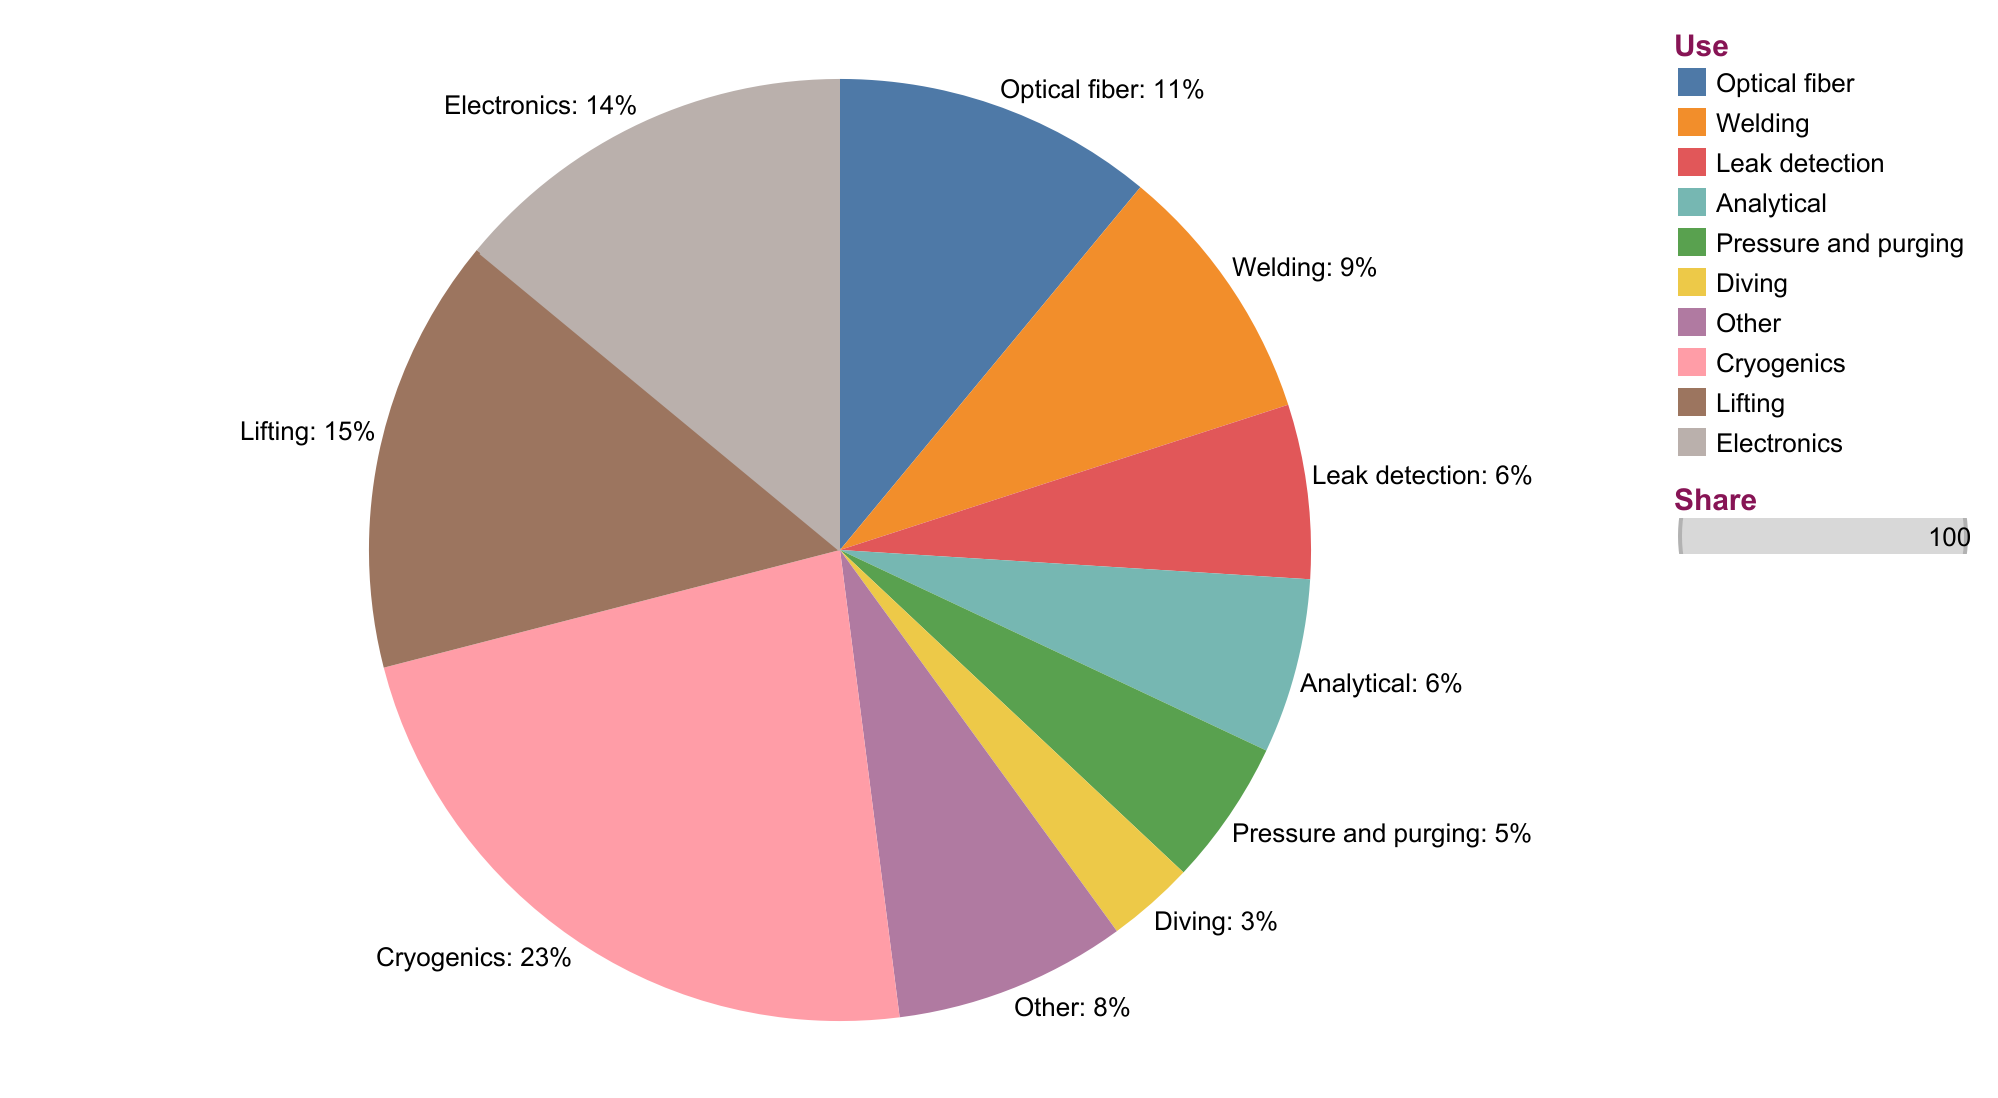
Description: Pie chart showing global helium demand by end use in 2019. Cryogenics make up the largest portion at 23% and lifting, which includes use in balloons, accounts for the second largest at 15%. Estimated global helium demand was 6.2 billion cubic feet in 2019.

Be the first to comment