energy graph 2
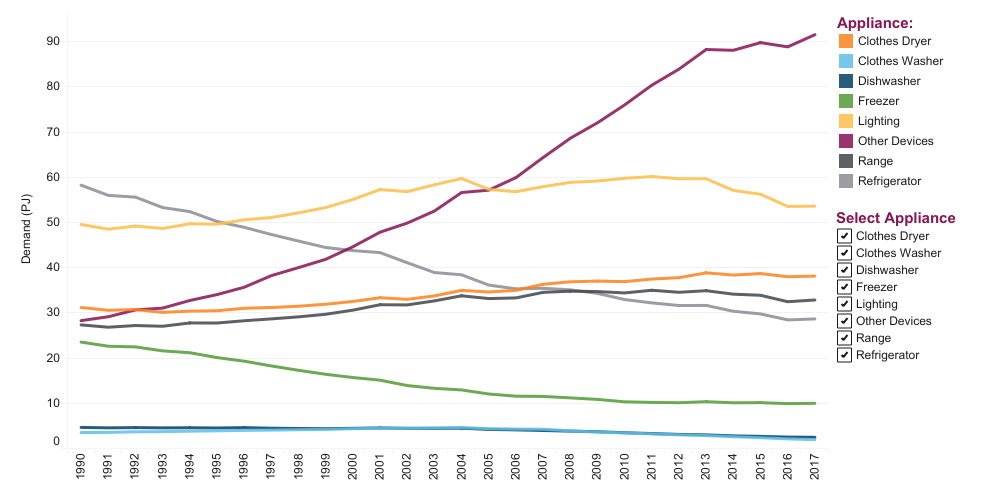
Source: Natural Resources Canada Comprehensive End-Use Database
Description: This line chart shows the relative energy use by various appliances in Canada’s residential sector between 1990 and 2017. This includes lighting, refrigerators and freezers, dishwashers, clothes washers, ranges and other devices. To see an animated version of this graph, click here.

Be the first to comment