
Production continued to increase through price fluctuations in Bakken and Permian basins
U.S. crude oil production reached 10.038 million barrels per day (b/d) in Nov. 2017, according to EIA’s latest Petroleum Supply Monthly.
Nov. production is first time since 1970 that monthly U.S. production levels surpassed 10 million b/d and the second-highest U.S. monthly oil production value ever, just below the Nov. 1970 production value of 10.044 million b/d.
Within the Lower 48 states, Nov. 2017 production reached a record high in Texas at 3.89 million b/d, followed by North Dakota at 1.18 million b/d.
Production in the Federal Gulf of Mexico reached 1.67 million b/d, up 14 per cent from the Oct. 2017 level as the region recovered from Hurricane Nate.
The production values presented here are based on EIA’s monthly survey of crude oil production, which, for reasons explained in a webinar presented earlier this week, are considered more comprehensive and reliable values of U.S. crude oil production than the preliminary estimates presented in EIA’s Weekly Petroleum Status Report.
U.S. crude oil production has increased significantly over the past 10 years, driven mainly by production from tight rock formations including shale and other fine-grained rock using horizontal drilling and hydraulic fracturing to improve efficiency.
EIA estimates of crude oil production from tight formations in Nov. 2017 reached 5.09 million b/d, surpassing a previous high of 4.70 million b/d in March 2015.
These formations also produce considerable volumes of natural gas associated with the crude oil.
Liquid production—both crude oil and condensate—from tight rock currently accounts for about 51 per cent of total production.
A decade ago, in Nov. 2008, production from tight formations accounted for only 7 per cent of total U.S. production.
Non-tight oil production has been mostly constant over the previous decade.
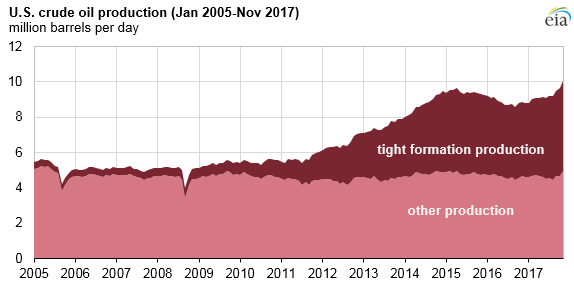
Tight oil production can be sensitive to changing oil prices. After increasing relatively steadily since 2011, tight oil production began to decline after the West Texas Intermediate (WTI) crude oil price decreased from $105 per barrel (b) in June 2014 to a low of $30/b in Feb. 2016. WTI prices were about $60 a barrel in Jan. 2018.
Production continued to increase through these price fluctuations in three formations in the Permian Basin—the Spraberry, Bone Spring, and Wolfcamp plays that span parts of western Texas and eastern New Mexico—and in the Bakken formation in the Williston Basin in North Dakota and Montana.
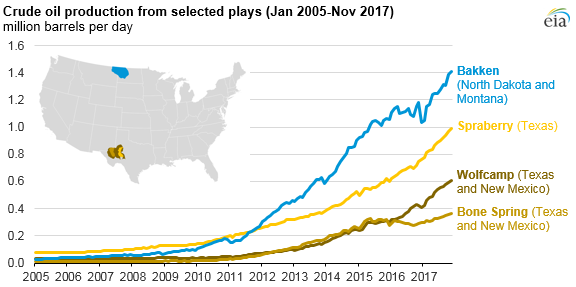
The volumes shown here for each play are geologic formation subsets of the regional values presented in EIA’s Drilling Productivity Report.
Monthly values of tight oil and shale gas production from selected plays, compiled from oil and natural gas operator reports to state agencies, are available on the crude oil and natural gas production pages of EIA’s website.

Be the first to comment