COVID-19 graph 2
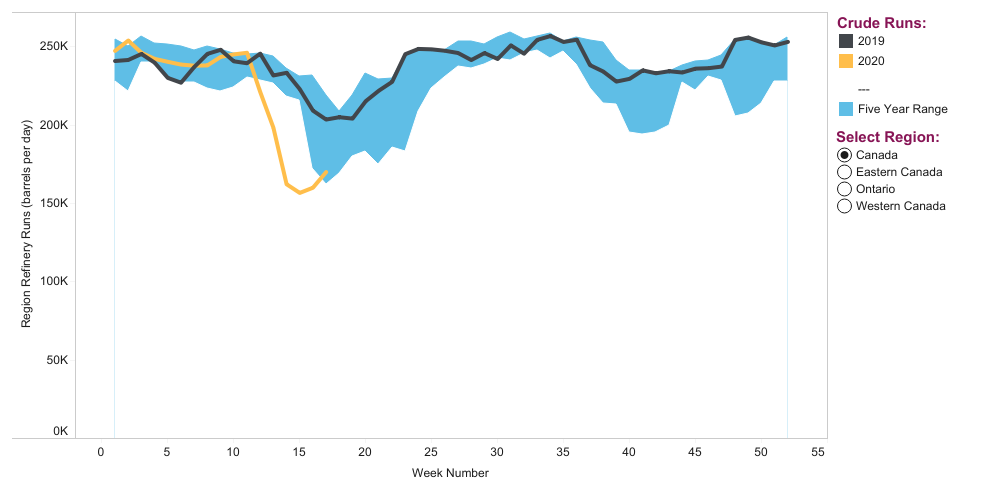
Source: CER
Description: The chart shows weekly Canadian refinery utilization in percent for weeks ending 7 January 2020 through 14 April 2020. Refinery utilization has dropped from 91 per cent for the week ending 7 January 2020 to 57 per cent for the week ending 14 April 2020. This is a drop of 37 per cent. To see an animated version of this graph, click here.

Be the first to comment