fuel economy graph 1
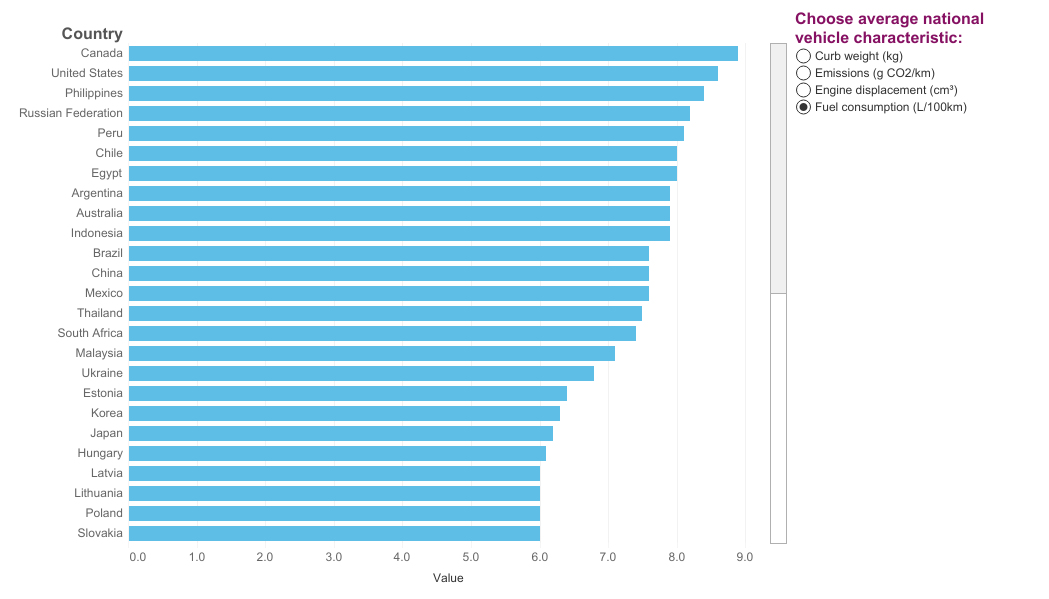
Source: International Energy Agency
Description: The bar graph ranks countries based on their average car’s CO2 emissions, weight, engine displacementFootnote 3, and fuel consumption. Canada’s cars are, on average, the least fuel efficient and most CO2 intensive. They also have the highest power and rank second in terms of weight, behind the United States. For a full, animated version of this graph, click here.

Be the first to comment