Renewables graph 2
Source: EF2020
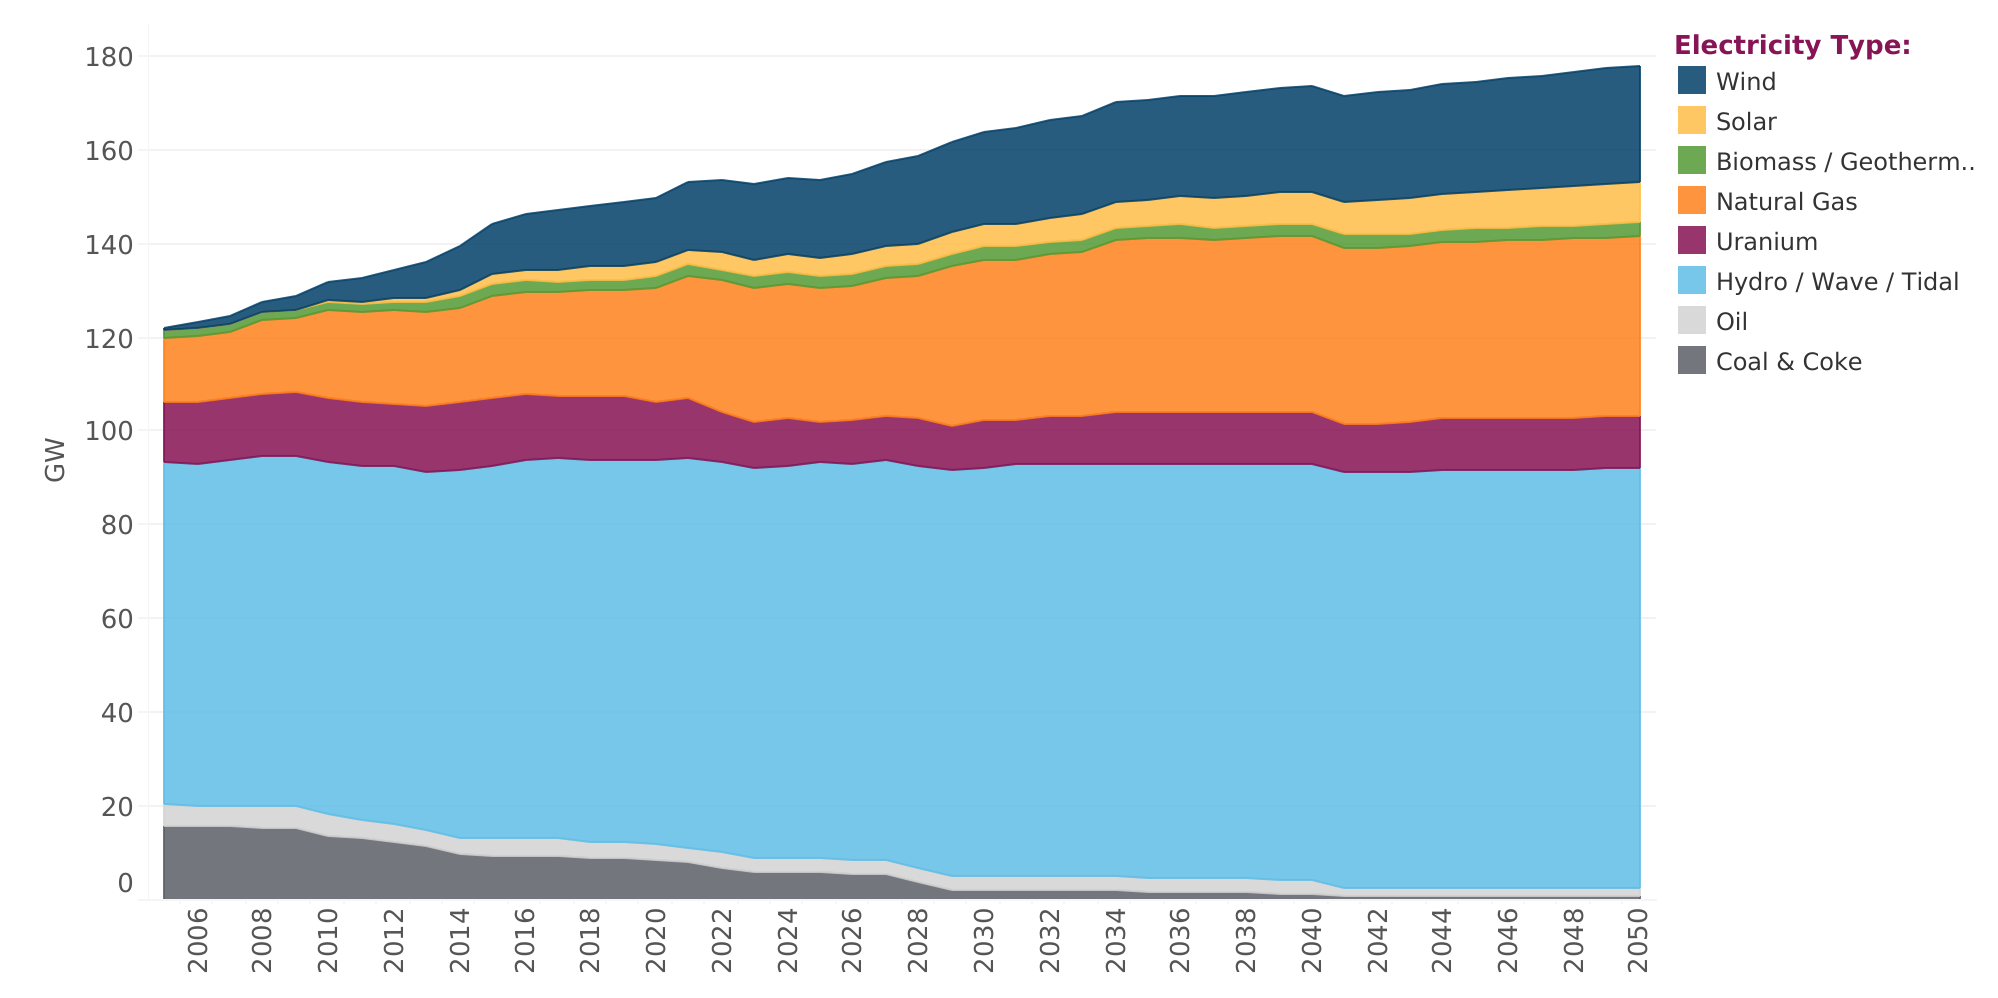
Description: The stacked area graph above shows Canada’s total installed generating capacity from 2005 to 2050 under the Evolving Scenario. Total capacity in 2005 was 122 GW and increases to 211 GW in 2050.

Be the first to comment