Dashboard 1 – Exports
Source: CER Commodity Statistics – Table 3A – Export Sales Summary Report by Destination and Source
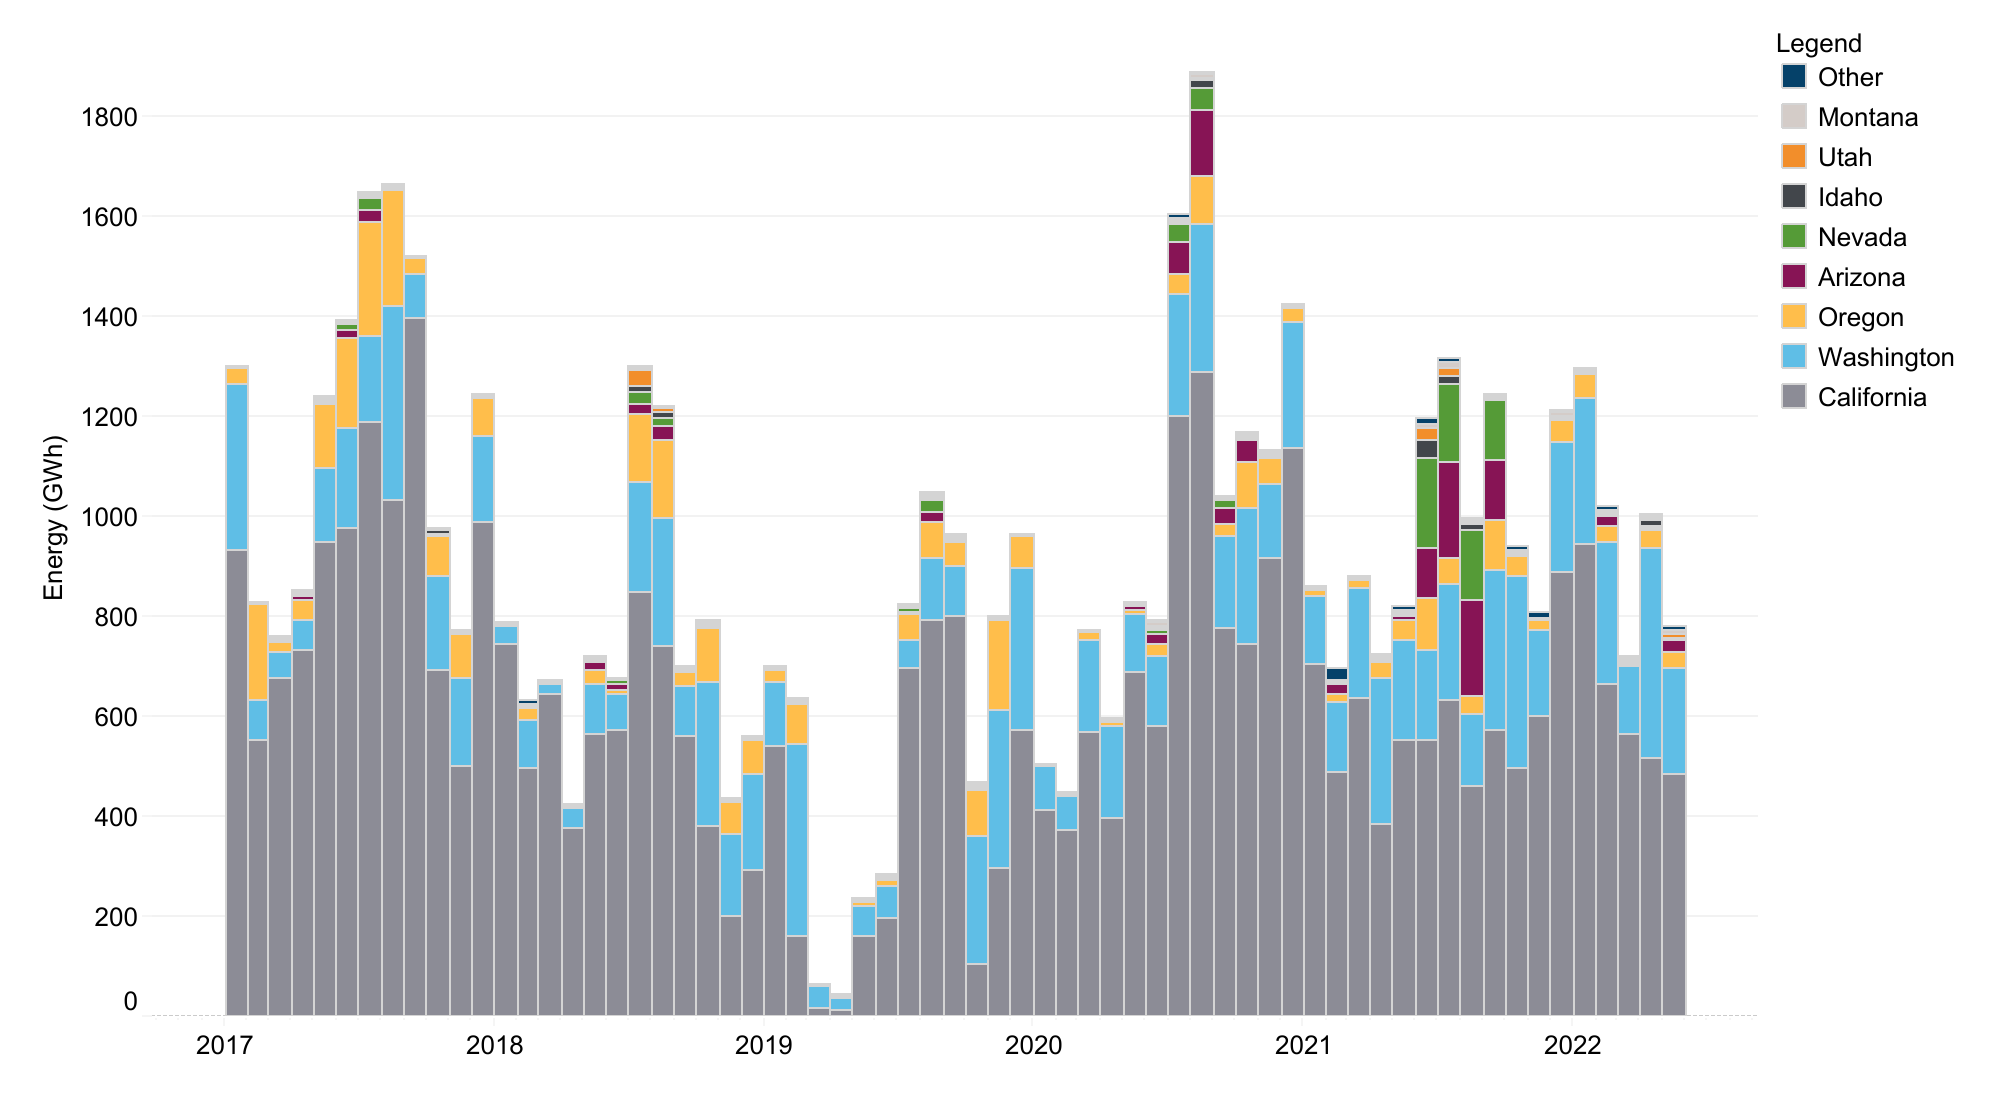
Figure Description: This stacked bar graph shows monthly electricity volumes in gigawatt hours (GWh) exported from B.C. from January 2017 to May 2022. The electricity exports are ordered by states with the most to least volumes transferred from B.C. in the entire period: California, Washington, Oregon, Arizona, Nevada, Idaho, Utah, Montana, and Other. The other category groups the following states which B.C. transferred the least electricity to: Wyoming, Nebraska, New Mexico, Colorado, Texas, and Alaska. To see an animated version of this graph, click here.

Be the first to comment