shaunavon formation wells NEB
Source: IHS Markit with permission
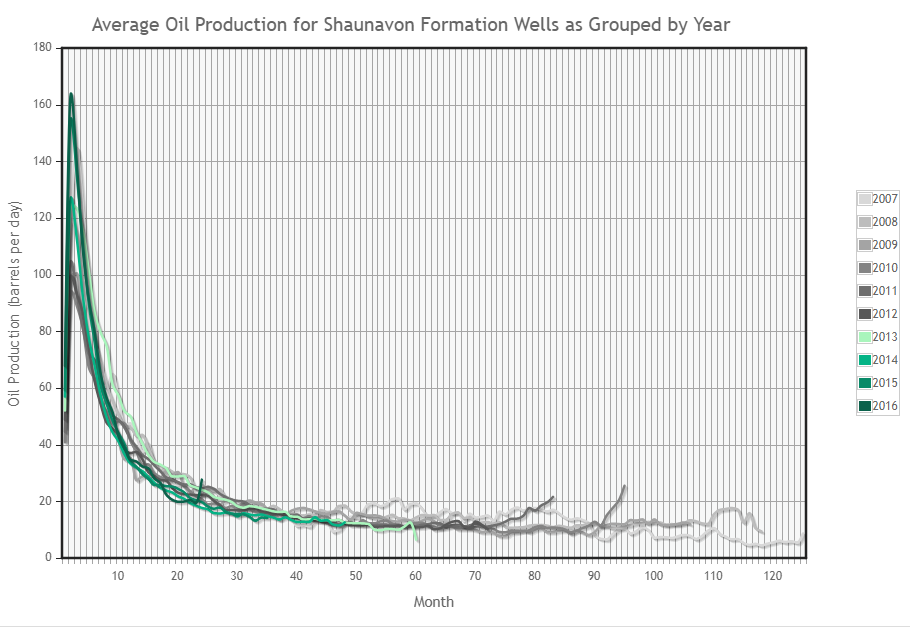
Description: This line graph shows the average annual decline curves for horizontal wells drilled into the Shaunavon Formation by year from 2007 to 2016. Curves for all years peak in the first 2 or 3 months of production before decreasing sharply over the next 18 months. After 18 months, rates decline at a much slower rate. Older wells tend to peak at lower rates than newer wells, but have higher rates of production after the first year. Production in 2007 peaked at 145 b/d per well in the first month of production, then decreased to 48 b/d after 12 months. Production in 2016 peaked higher at 164 b/d, however declined faster to reach 34 b/d after 12 months.

Be the first to comment