Ontario energy use
Source: IESO
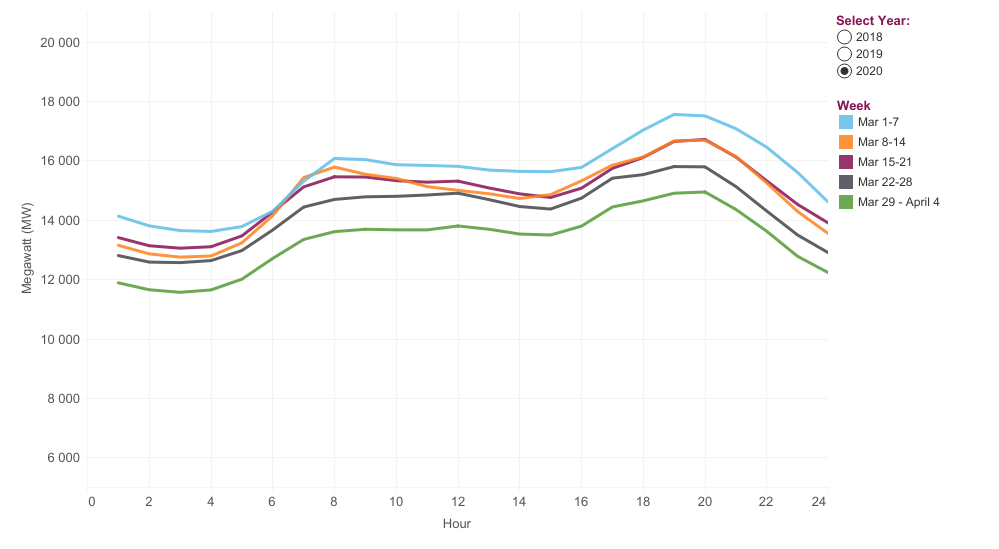
Description: This figure illustrates average daily electricity demand in Ontario, in March 2018, March 2019, and March 2020. The horizontal axis represents the hour of the day, starting at 1:00AM and finishing at midnight. The lines represent average hourly demand for given weeks. The vertical axis represents power demand, in megawatts (MW). There is generally a decline in power demand through March, as the weather transitions from winter to spring.

Be the first to comment