
This article was published by the Canada Energy Regulator on April 29, 2020.
On 12 March 2020, the World Health Organization declared COVID-19 a pandemic. Since then, energy demand decreased around the world as a result of measures aimed at slowing the virus spread.
In Ontario throughout March 2020, these measures led to flattening of the electricity demand curve. They likely also lowered demand compared to previous years.
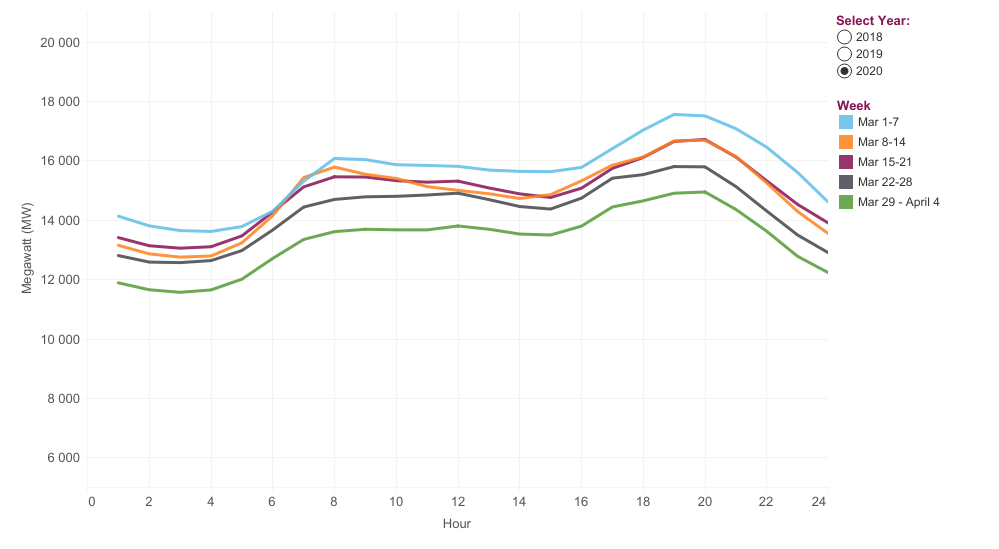
Description: This figure illustrates average daily electricity demand in Ontario, in March 2018, March 2019, and March 2020. The horizontal axis represents the hour of the day, starting at 1:00AM and finishing at midnight. The lines represent average hourly demand for given weeks. The vertical axis represents power demand, in megawatts (MW). There is generally a decline in power demand through March, as the weather transitions from winter to spring.
Electricity demand in Ontario generally peaks twice a day: when workers are getting ready to go to work (between 7:00 and 9:00), and in the evening (between 19:00 and 20:00). COVID-19 self-isolation measures led to more people working from home and starting their day later; which resulted in flattening Ontario’s peak daytime demand and increasing residential consumption between 9:00 and 19:00. Nighttime residential electricity demand appears to follow more typical consumption patterns. Similar impacts on residential demand is seen in other regions like Texas.
The increase in residential electricity demand is offset, at least partly, by reduced demand in the commercial and institutional sectors.
Weather also impacts electricity demand. In Toronto, March 2020’s temperature averaged 3.96 °C, compared to 0.14 °C in March 2019, and 1.32 °C in March 2018 (see Appendix). Higher temperatures in March 2020 reduced electricity demand for heating.
Ontario’s residential, and commercial and institutional sectors make up 31 per cent and 36 per cent, respectively, of the province’s electricity demand; which is more than most provinces.Footnote1 Electricity demand in other provinces may be impacted differently than Ontario.
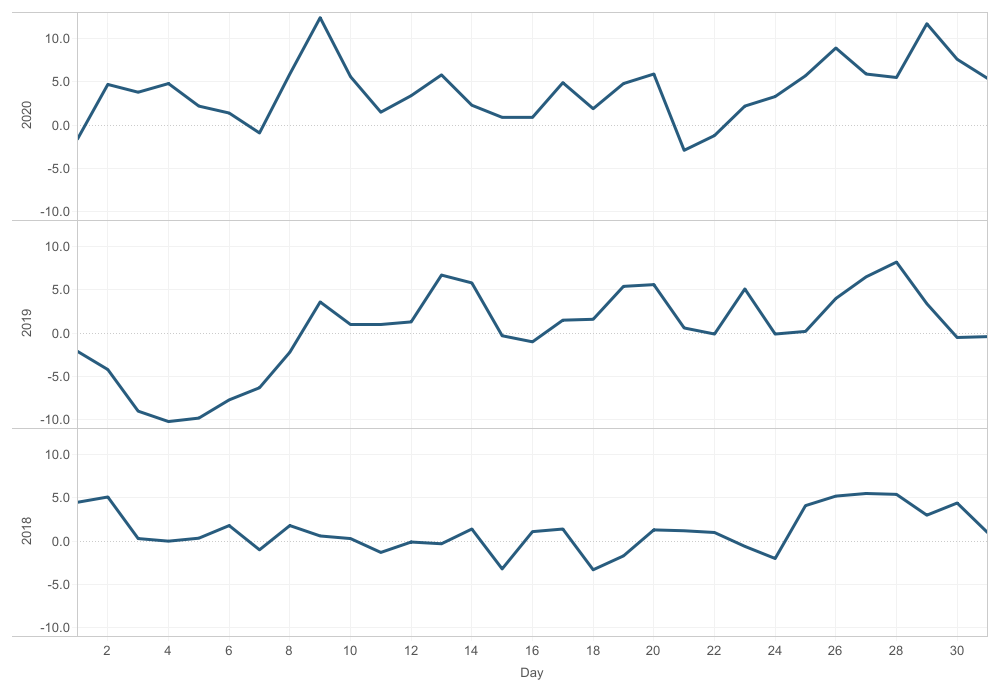
Description: This figure shows average daily temperature in Ontario (Toronto), in degrees °C, for March 2018, March 2019, and March 2020. In Toronto, the temperature averaged 3.96 °C in March 2020, 0.14 °C in March 2019, and 1.32 °C in March 2018.

Be the first to comment