
This article was published by the National Energy Board on June 5, 2019.
In the future, electric vehicle adoption presents a key uncertainty for understanding how energy systems will evolve. In 2018 almost 44,000 electric vehicles (EVs) were sold in Canada, a substantial increase from the 2 000 sold in 2012.
Many factors will influence future EV sales including cost, government policy, consumer preferences, advances in technology, and charging infrastructure.
Currently, EVs are more expensive to buy than conventional vehicles with an internal combustion engine (ICE). However, EVs are more energy efficient than ICE vehicles, which could lead to cost savings when driving. Figure 1 compares prices and fuel efficiency for some of the most popular models of EVs and ICE vehicles. Hybrid vehicles, which have both internal combustion engines and electric motors, have not been included in this analysis.
EVs have maintenance costs that are about 70 per cent below comparable ICE vehicles. This is partly because EVs have fewer moving parts in their drivetrains and do not need oil changes. EVs also use regenerative braking, which converts motion to electricity to slow a car down and helps brakes last longer.
Figure 1: Comparison of Costs between Selected EV and ICE Vehicles
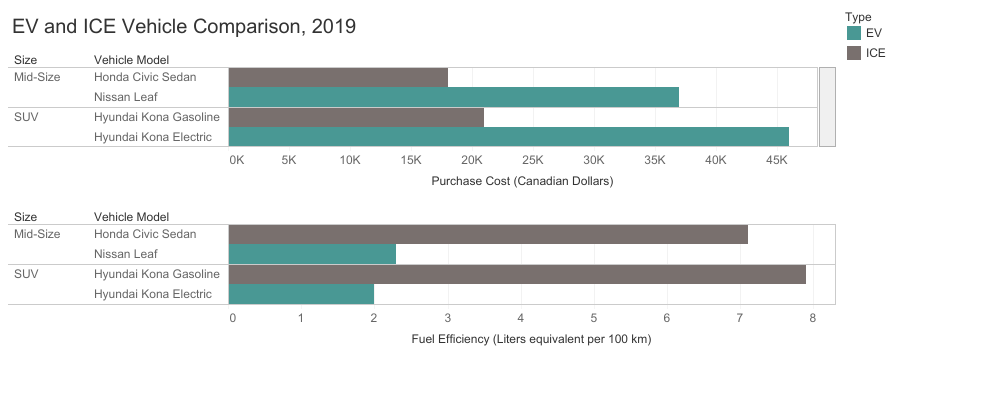
Description: This chart shows the difference in both purchase prices and fuel efficiency for some popular passenger vehicles in Canada. Purchase prices for EVs are currently much higher than those of comparable ICE vehicles, but are much more energy efficient. Fuel efficiency comparisons between EVs and ICE vehicles are done using liters equivalent per 100 km (Le/100km), which converts electricity into an equal amount of gasoline based on energy content.
Figure 2 shows the future purchase costs of EVs and ICE cars and trucks, as assumed in the Reference Case and Technology Case from the NEB’s Canada’s Energy Future 2018 (EF2018) report. Sales of electric vehicles reach over 60 per cent of new vehicles sold by 2040 in the EF2018 Technology Case, while the Reference Case sees slower growth. Meanwhile, in both cases, EVs will continue to be more expensive to purchase than comparable ICE vehicles until 2040. In both projections, however, the prices of ICE vehicles slightly climb while the prices of EVs fall. EV prices fall more in the Technology Case than in the Reference Case, because the Technology Case expects faster adoption of EVs and technology that improves more quickly.
Figure 2: Projected Purchase Costs of EVs and ICE Vehicles in 2020, 2030, and 2040 Source: NEB
Description: The projected vehicle prices from EF2018’s Reference Case and Technology Case are shown in the graph for 2020, 2030, and 2040. While the prices of ICE cars and trucks are generally lower than their EV equivalents, the graph shows that in both cases, the price of ICE vehicles slightly climbs over the projection, while the price of EVs falls. The size of this decrease is larger in the Technology Case.
Levelized cost of driving is a way to compare EVs and ICE vehicles
Levelized cost of driving (LCOD) calculates how much it costs to drive a vehicle per kilometer over the vehicle’s life. LCOD is used to compare vehicles with different purchase, fuel, and maintenance costs and lifespans. Thus, LCODs are a useful way to compare EVs to ICE vehicles.
Figure 3 shows LCODs for vehicles purchased in the years 2020, 2030, and 2040 as calculated from EF2018 cost data. In 2020, EV cars have a lower LCOD than ICE cars in most provinces in both the Reference Case and the Technology Case. By 2030, EV cars have a lower LCOD than ICE cars in all provinces in both cases.
In most provinces, except Ontario, Northwest Territories, and Nunavut, EV trucks have a lower LCOD than ICE trucks in both cases. In 2040, EV cars and EV trucks have a lower LCOD in all provinces and in both cases. Because of abundant hydroelectricity in Canada, electricity prices are low in regions such as Quebec and British Columbia, which lowers the LCOD of EVs. Meanwhile, in the Technology Case, carbon prices are much higher than in the Reference Case. This makes gasoline more expensive and contributes to the advantage that EVs have over ICE vehicles.
Additionally, as shown in Figure 3, the purchase cost of an EV in Canada makes up around 82% of the LCOD in 2020 in the Reference Case, while it only contributes to 61% of an ICE vehicle’s LCOD. Fuel costs, on the other hand, make up about 9% of the LCOD of an EV car in 2020 in the Reference Case, while they contribute 29% of the LCOD of an ICE car, with maintenance costs making up about the last 10%.
Figure 3: Projected LCOD Comparisons for EVs and ICE Vehicles in 2020, 2030, and 2040

Description: The chart shows estimated LCODs by year, vehicle type, region, and EF2018 Case. In 2020, EV cars in most provinces have a lower LCOD than ICE cars. By 2030, EV cars in all provinces have a lower LCOD. In most provinces, except those with the most expensive electricity, EV trucks have a lower LCOD. In 2040, EV cars and trucks in all provinces have a lower LCOD.
For example, the Reference Case Canadian LCOD is $0.33/km for an EV car, $0.34 for an ICE car, $0.44 for an EV truck and $0.42 for an ICE truck in 2020. However by 2040, the LCOD of an EV car drops to $0.29/km, and to $0.33 for a comparable ICE car. In the same year the LCOD for an EV truck reaches $0.37/km and $0.41 for an ICE truck.
Key takeaways from this analysis include that EV cars have lower LCODs than ICE cars in the near future
Some key takeaways on projected LCOD comparisons are that both purchase cost and fuel efficiency are important. For example in 2020, the price of an EV truck is about C$ 13 500 more than a comparable ICE truck, but after fuel cost savings are taken into account, the LCODs become much more comparable (although there are significant variations between regions).
Further cost reductions in the price of EVs are important in both the Reference and Technology Cases, and help LCODs of EVs become comparable to those of ICE vehicles. These cost assumptions cause EVs to gain parity in many regions by 2020, and in almost all of them by 2030, and 2040 for both cases.
EV cars have lower LCODs than ICE cars in the near future, while this is further off for larger vehicles.
It is important to remember that vehicles are purchased for many reasons beyond purchase price, operating costs, and maintenance costs. A good example of this can be found by comparing the LCOD of ICE cars and ICE trucks. The LCODs of ICE trucks are much higher than that of ICE cars, yet trucks dominate vehicle sales in Canada.
Levelized cost of driving is very sensitive to changes in assumed costs
LCOD can vary significantly when costs are changed. For example, the LCOD for both EVs and ICE vehicles decrease if distance driven increases to 20 000 km/year from 15 000 km/year, because more kilometers spread out vehicle purchase costs. However, EV LCOD falls more than for ICE LCOD because fuel costs are cheaper for EVs.
Meanwhile, if a vehicle is driven only 10 000 km/year, then LCOD will increase for both types of vehicles, but more so for EVs since their fuel savings matter less. Also, various discount rates reflect the interest that could be earned by investing the money rather than spending it and puts different values on future expenses. A lower discount rate would make EVs relatively more attractive. The chart below shows the results of these changes.
Figure 4: LCOD Sensitivity Analysis
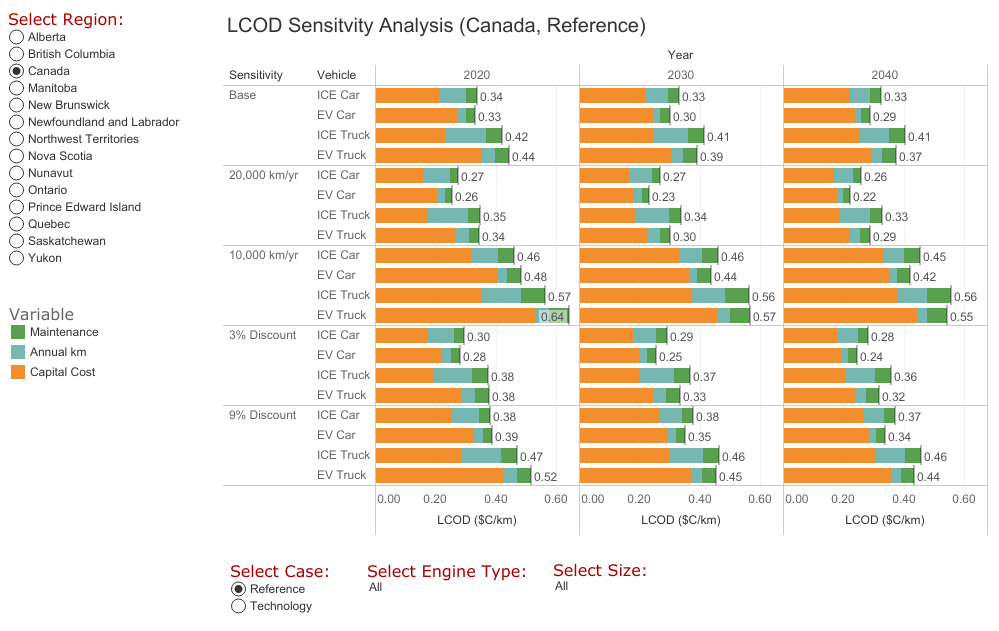
Description: This chart shows how changes to distance driven per year and the discount rate used can affect the LCOD. When a vehicle is driven more km every year, the LCOD decreases since the purchase cost is spread out over more km. If a higher discount rate is used, less value is put on future fuel and maintenance costs also resulting in a lower LCOD. The reverse is also true for both of the above statements.

Be the first to comment