
This article was published by the Canada Energy Regulator on Apr. 1, 2020.
Canada imports around one barrel of crude oil for every seven barrels it produces. Canadian crude imports increased 3 per cent in 2019, from 634 thousand barrels a day (Mb/d) in 2018 to 655 Mb/d.
The United States continues to be the largest source of Canada’s imported crude oil. In 2019, over 70 per cent of Canadian crude imports came from the U.S., compared to 64 per cent in 2018. A higher volume of imports also came from the Russian Federation.
Imports from Norway, Saudi Arabia, Azerbaijan, and Nigeria decreased from 2018.
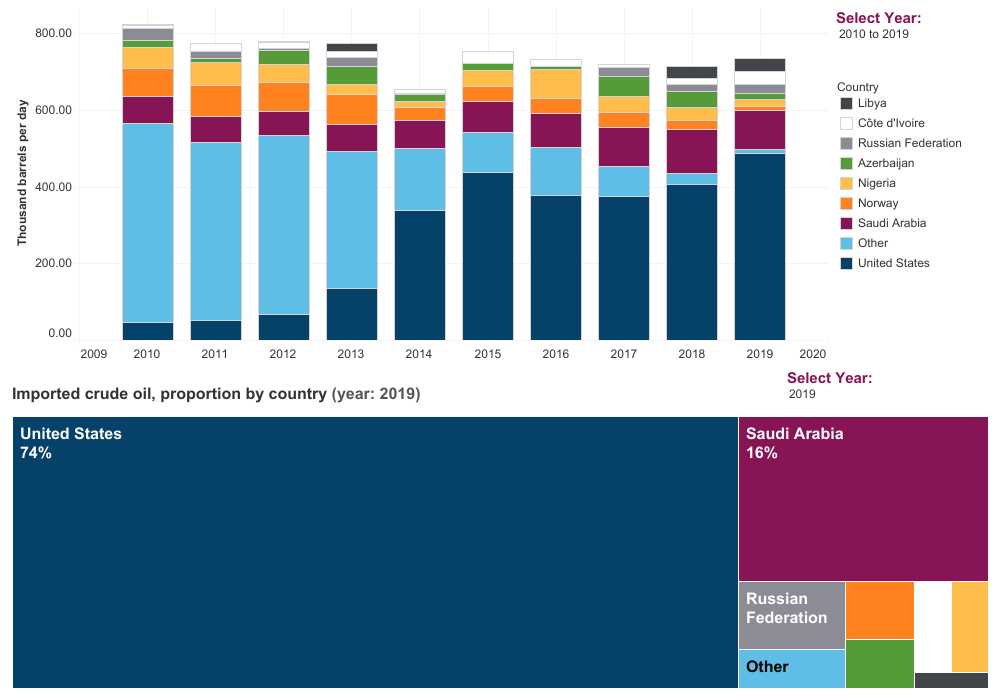
Description: This stacked bar chart shows imports of crude oil to Canada by country of origin from 2010 to 2018. Imports increased between 2018 and 2019 from 634 Mb/d to 655 Mb/d. The shares of imports to Canada in 2019 were 74% from the United States, 16% from Saudi Arabia, 3% from the Russian Federation, 2% from Norway, 1% from Nigeria, 1% from Azerbaijan, 1% from Côte d’Ivoire, and 2% from others. To see a fully animated version of this graph, click here.
The provinces that import the most crude oil are New Brunswick, Quebec, Newfoundland and Labrador, and Ontario. The majority of crude oil imported by the refineries in New Brunswick and Newfoundland comes by marine tankers.
Although Quebec’s refineries import some crude oil by marine tankers, most crude oil imports travel by pipeline from the U.S. Both New Brunswick and Quebec’s refineries can import crude by rail from the U.S.; however, this is not typically done.
Crude oil imports to Ontario’s refineries are only by pipeline.
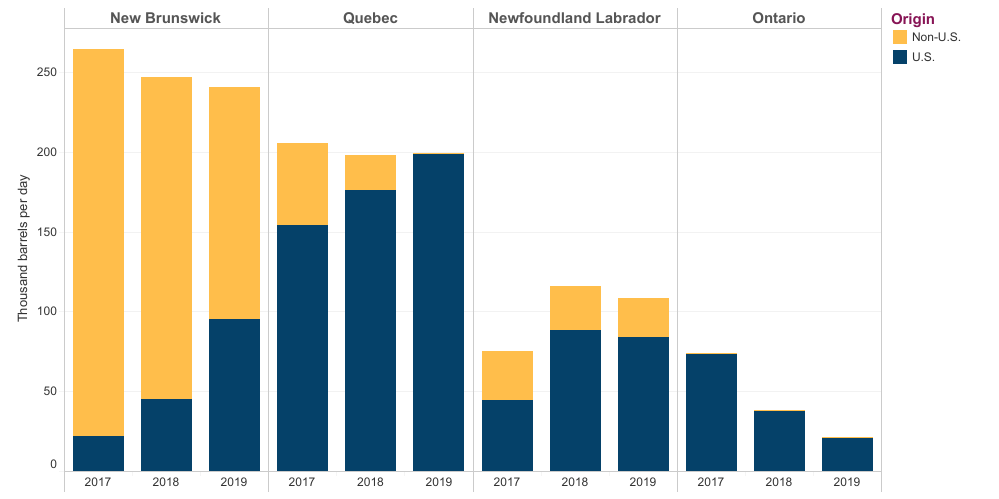
Description: This stacked bar graph shows imports into New Brunswick, Quebec, Newfoundland and Labrador, and Ontario from 2017 to 2019, separated into U.S. and non-U.S. imports. Imports into New Brunswick decreased in 2019 to 240 Mb/d, and 95 Mb/d came from the U.S. Imports into Quebec increased to 200 Mb/d, and 200 Mb/d of imports came from the U.S. Imports into Newfoundland and Labrador decreased to 108 Mb/d, and 84 Mb/d of imports came from the U.S. Imports into Ontario decreased to 21 Mb/d, and all came from the U.S. To see a fully animated version of this graph, click here.

Be the first to comment