
International action on climate change has grown since global commitments were made in the 2015 Paris Agreement. In Canada, more ambitious climate commitments were made in April 2021. These include:
- Increasing the original 2030 target of a 30 per cent reduction of greenhouse gasses (GHGs) below 2005 levels to 40-45 per cent reduction, and
- Achieving net-zero* emissions by 2050.
When the Canada Energy Regulator (CER) reviews infrastructure projects under the Canadian Energy Regulator Act, one of the factors it considers is how a project could affect the Government of Canada’s ability to meet its environmental obligations and commitments toward climate change, which includes emissions targets.
What is Environmental, Social, and Governance (ESG) Reporting and why does it matter in meeting net-zero emission targets?
One of the ways climate commitments are being measured is through the inclusion of environmental, social, and governance (ESG) metrics in investment decisions, government policies, and business strategies.
ESG metrics are nonfinancial factors that are relevant to stakeholders and can highlight additional risks and opportunities.1 These metrics are evolving, illustrating the changing public interest in Canada and internationally, and may include:
- Environmental measures that consider how a company performs in reducing pollution and emissions, water usage, and land reclamation.
- Social metrics that show how a company integrates community livelihood, diversity, and equality into its operations.
- Governance criteria that highlights a company’s culture, leadership, executive pay, internal controls, and shareholder rights.
Examples of Environmental, Social, and Governance (ESG) Metrics
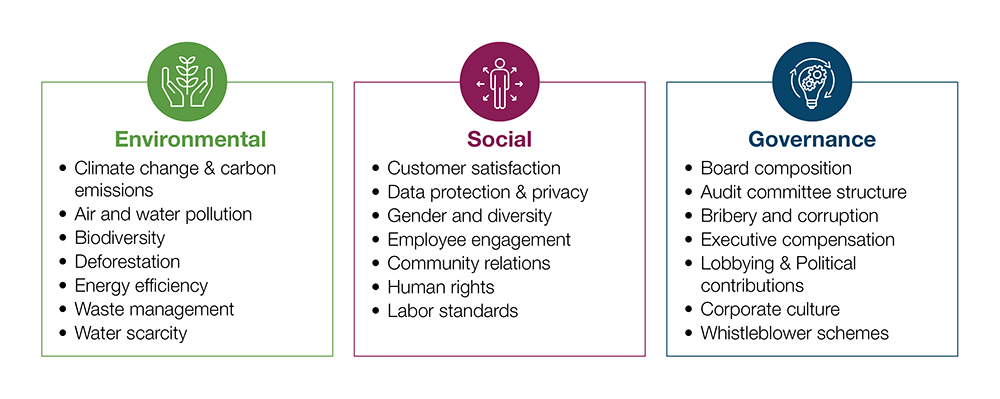
Source: CFA ESG Investing and Analysis
Description: The graphic gives examples of metrics under each environmental, social, and governance category. Environmental can include climate change & carbon emissions, air and water pollution, biodiversity, deforestation, energy efficiency, waste management, water scarcity. Social can include customer satisfaction, data protection & privacy, gender and diversity, employee engagement, community relations, human rights, labor standards. Governance can include board composition, audit committee structure, bribery and corruption, executive compensation, lobbying and political contributions, corporate culture, and whistleblower schemes.
Government policies to reduce emissions are becoming stricter, and shareholders are increasingly more interested in lower carbon projects that will pay less carbon tax and have lower environmental impacts. ESG reporting frameworks recommend companies disclose their emissions so stakeholders are better able to understand the organization’s resiliency to carbon policies. The major ESG reporting frameworks such as the Task Force on Climate-related Financial Disclosures (TCFD), the Sustainability Accounting Standards Board (SASB), and the Global Reporting Initiative (GRI) recommend that firms report their total GHG2 emissions in tonnes per year and, where suitable, the intensity in unit of production volume per year.
 Many CER-regulated companies produce ESG reports outlining their emissions. The following analysis explores how the publicly traded parent companies of the major pipelines regulated by the CER are reporting on ESG, specifically on their greenhouse gas (GHG) emissions and their commitment to reducing emissions. To do this, we examined pipelines detailed on the CER’s Pipeline Profiles page that are owned, partially or through a subsidiary company, by publicly traded companies. These nine companies represent about 88 per cent of the total length of CER-regulated pipeline.
What does emissions reporting by CER-Regulated companies look like?
All nine publicly traded parent companies mentioned above disclose some ESG metrics, typically in a “Sustainability Report.” It is more common for larger companies to have a standalone ESG report because of greater access to resources and expertise. Reported emissions are grouped into 3 categories (Scope 1, 2, 3) based on how closely emissions are tied to the company’s economic activities.
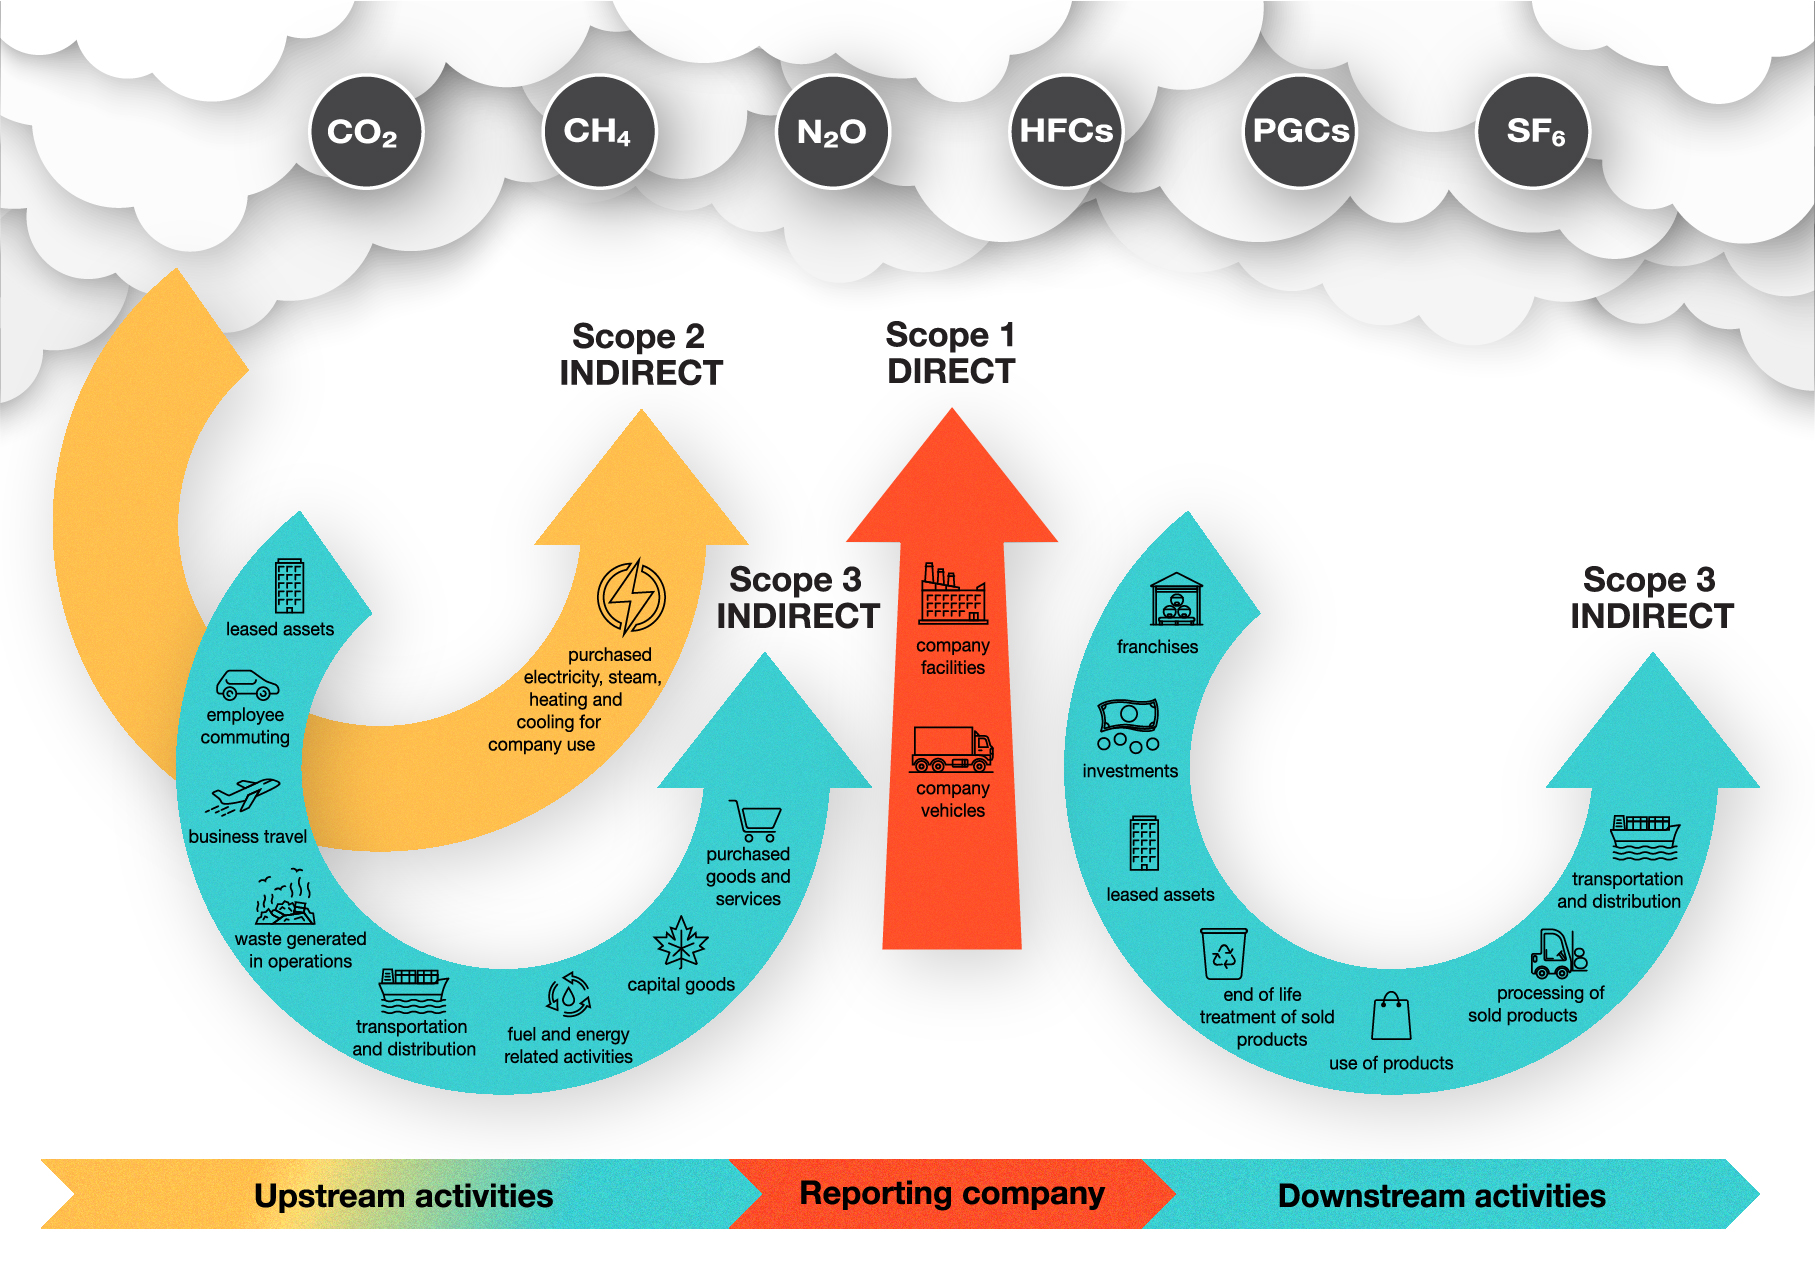
Source: GHG Protocol
Description: The infographic shows the three “scopes” that are defined for GHG emissions accounting and reporting purposes. Scope 1 are direct emissions from sources that are owned or controlled by the company. Scope 2 are indirect emissions from the generation of electricity, heat, or steam purchased by the company. Scope 3 are direct and indirect emissions that are a consequence of the activities of the company but occur from sources not owned or controlled by the company.
- All of the nine companies disclose direct GHG emissions occurring from sources owned or controlled by the company (Scope 1).3 These 8 companies also report indirect emissions that result from the generation of electricity, heat, or steam purchased by the company (Scope 2).
- Six companies also report Scope 3 emissions, sometimes referred to as “value chain emissions” that are from the activities of the company but occur from sources not owned or controlled by the company. For some companies, Scope 3 emissions can represent the largest portion of a company’s GHG emissions because they can include, for example, emissions from the end-use of a company’s products and employee commuting.4 Different business models and activities change the relative size of the different scopes for each company. The depth of ESG data provided by a company is also often linked to the size of the firm.
GHG emission reduction targets by CER-Regulated companies
Many companies have voluntarily pledged to reduce their GHG emissions and have set public targets. Seven out of nine parent companies set net-zero by 2050 emission goals with most of these targets covering Scopes 1 and 2. Firms that do not include Scope 3 emissions in their targets often state their rationale as focusing on the assets they directly control and operate. Not all these targets apply to pipeline assets regulated by the CER. For example, two of the parent companies set targets that apply only to their oil sands production.
The net-zero targets announced by these companies that explicitly apply to pipeline assets5 cover about 86 per cent of the total operating pipeline length regulated by the CER. This includes:
- 64 per cent of the length of oil pipelines (the CER regulates a total operating length of about 18 200 kilometres of oil pipeline). In terms of capacity, this represents 83 per cent of the total operating capacity of the major oil pipelines regulated by the CER.
- 95 per cent of the length of natural gas pipelines (the CER regulates a total operating length of 49 200 kilometres of natural gas pipeline). This represents almost 100 per cent of the total operating capacity of the major natural gas pipelines regulated by the CER.
Footnotes:
- CFA Institute 2020, ESG Investing and Analysis.
- GHGs include carbon dioxide, methane, nitrous oxide, hydrofluorocarbons, perfluorocarbons, and sulphur hexafluoride among others.
- GHG Protocol, (n.d.). A Corporate Accounting and Reporting Standard. World Business Council for Sustainable Development.
- EPA, (2020). Scope 3 Inventory Guidance. United States Environmental Protection Agency.
- Assumes that net-zero emissions targets will apply to pipelines that are jointly owned, if at least one partner that owns 50% or more has an applicable net zero target. Also assumes that net-zero aspirations at the parent company level will be applied to subsidiaries.

Be the first to comment