fuel economy graph 3
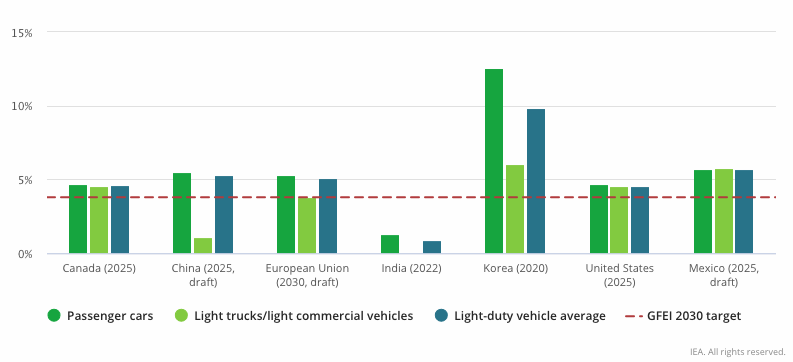
Source: International Energy Agency. Click here to see an animated version of this graph.
Source: International Energy Agency. Click here to see an animated version of this graph.
@2020 Energi Media Ltd., | Thoughtful Energy Journalism

Get the eBook, The New Alberta Advantage: Technology, Policy, and the Future of the Oil Sands, written by our founder and publisher, Markham Hislop, for FREE.
Sign up now and get exclusive access to your FREE download in the next newsletter and receive Energi Media Weekly Update straight to your inbox too!
Be the first to comment