
This article was published by the International Energy Agency on April 24, 2019.
Natural gas production
In 2018, the OECD natural gas production increased by 7.4 per cent compared to 2017 and reached a record total production of over 130 bcm in December 2018.
Most of the growth was observed in the OECD Americas (+9.3 per cent ) and originated from the USA (+11.5 per cent) where the shale revolution broke through.
OECD Asia Oceania supplemented the natural gas production increase (+12.9 per cent ) as Australia (+15.9 per cent ) is still in the process of ramping up the output of the Itchys gas-condensate field in the Browse basin, and should meet full production over the next two years.
OECD Europe, however, experienced a 3.6 per cent fall in its natural gas production, following the commitment to reduce the exploitation of the Groningen field in the Netherlands ( -9.6 per cent ). This is the largest gas field in Europe, but drilling operations and works performed on site led to frequent earthquakes in the region over the past years.
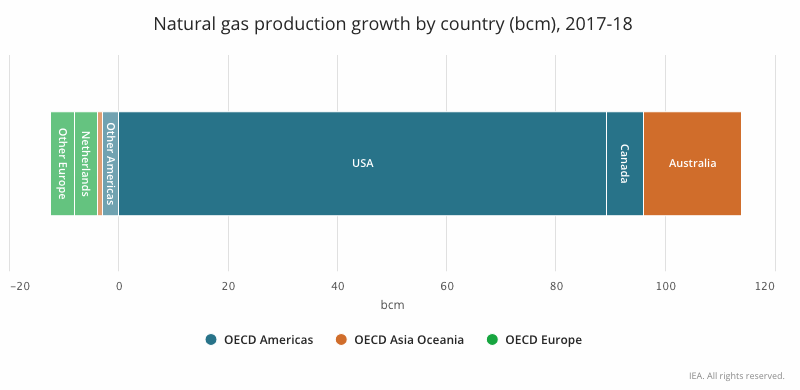
The USA, Australia and Canada represent most of the yearly production increase in 2018, with +89 bcm, +18 bcm and +7 bcm of natural gas produced respectively, out of the 101 bcm increase observed at the OECD level.
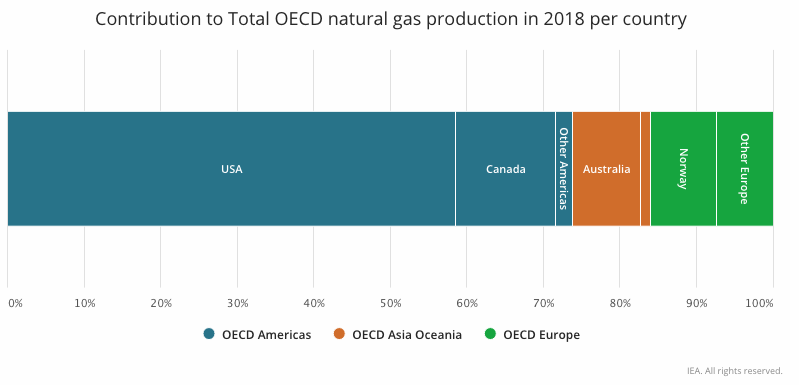
These three countries account for 80.4 per cent of the natural gas production of the OECD area in 2018, from 78.1 per cent in 2017.
Natural gas gross deliveries
Total OECD natural gas gross deliveries increased by 3.5 per cent in 2018 compared to 2017. Both the OECD Americas and OECD Asia Oceania contributed with growth of 7.5 per cent and 2.9 per cent respectively, while natural gas gross deliveries to OECD Europe shrunk by 3.6 per cent .
Most of the growth in the OECD Americas was led by the USA (+10.5 per cent ) where 14.5 GW of net natural gas power generation capacity were added in 2018.
Additionally, weather conditions in 2018 pushed the natural gas consumption for the power sector with several periods of extreme cold or warm weather, while power generation accounts for one-third of natural gas consumption in the USA.

In OECD Asia Oceania, Korea drove the increase in deliveries of natural gas in 2018 with a 11.9 per cent growth, reflecting the increased natural gas use for electricity and heat generation.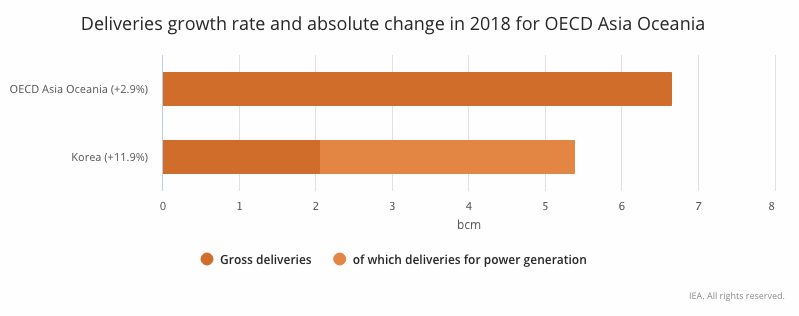
The decrease observed in natural gas deliveries in OECD Europe took place after three years of consecutive growth and was due to the combination of mild weather with above-average temperatures and lower demand in both gas-fuelled power generation and energy intensive industries.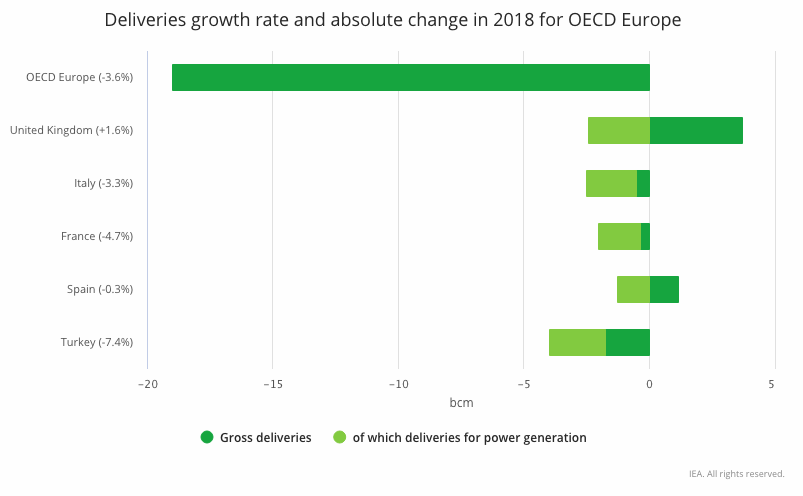
Natural gas trade
Total OECD imports (entries) of natural gas increased by 0.6 per cent in 2018 compared to 2017, which represents about 6.3 bcm.
While both OECD Asia Oceania and OECD Europe increased their imports, by 3.4 per cent and 1.5 per cent respectively, the OECD Americas experienced a contraction of its natural gas imports by 8.0 per cent .
From a liquefied natural gas perspective, total OECD imports grew by 5.7 per cent , mostly driven by the continued growth observed in the imports from the USA (+86.1 per cent ) and from Australia (+12.1 per cent ).
Otherwise, there were more moderate increases in imports reported as originating from non-OECD natural gas exporting countries, and for some of them even a fall.
This now places the USA – net exporter for the second consecutive year – among the largest LNG exporters, while Qatar remains the main supplier of the OECD overall.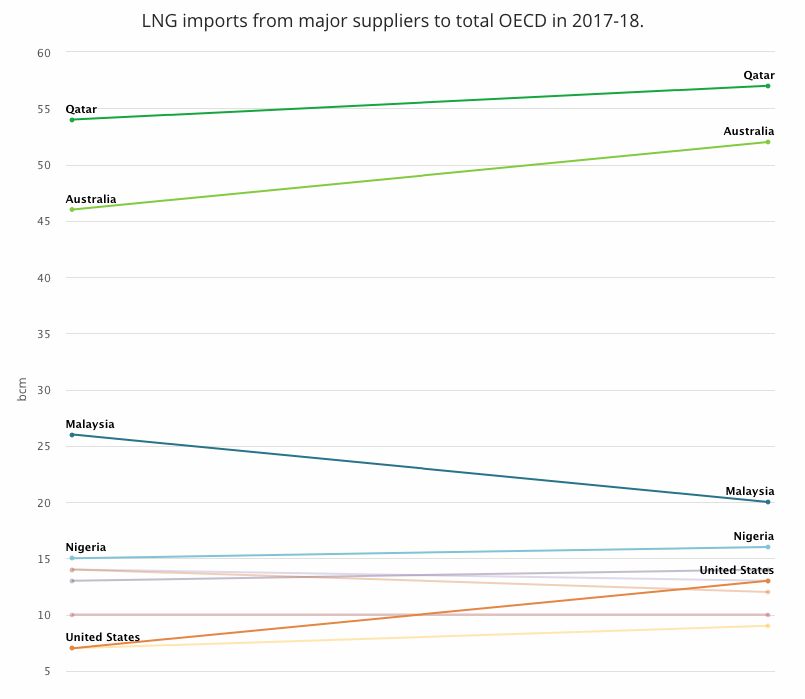
Total OECD exports (exits) of natural gas went up by 4.4 per cent in 2018 compared to 2017. This growth was supported by all OECD regions and represents about 31 bcm more than in 2017, of which 14 bcm were liquefied natural gas.
Overall, in 2018 the OECD area was again a net importer of natural gas, mostly due to the OECD Europe zone, while the OECD Americas is getting less and less dependent on natural gas imports.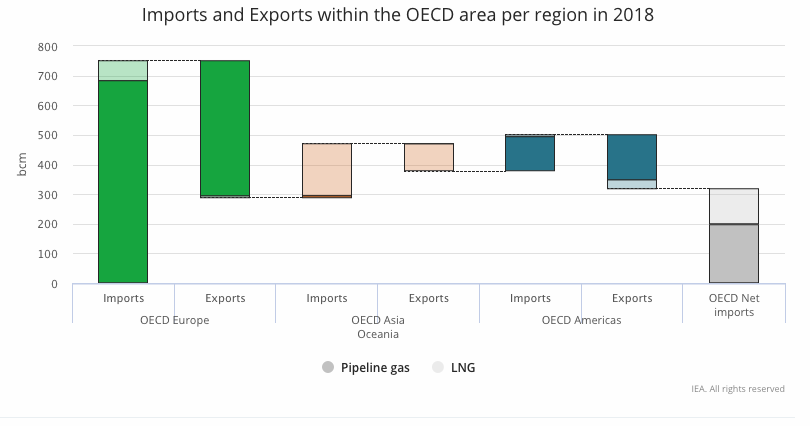
Notes
- All annual comparisons are based on monthly data in 2018 compared to monthly data in 2017.
- Transit volumes are included in imports and exports. Trade amounts include intra-regional trade.

Be the first to comment