Fig. 1
Source: CER, Pipeline Throughput and Available Capacity Data
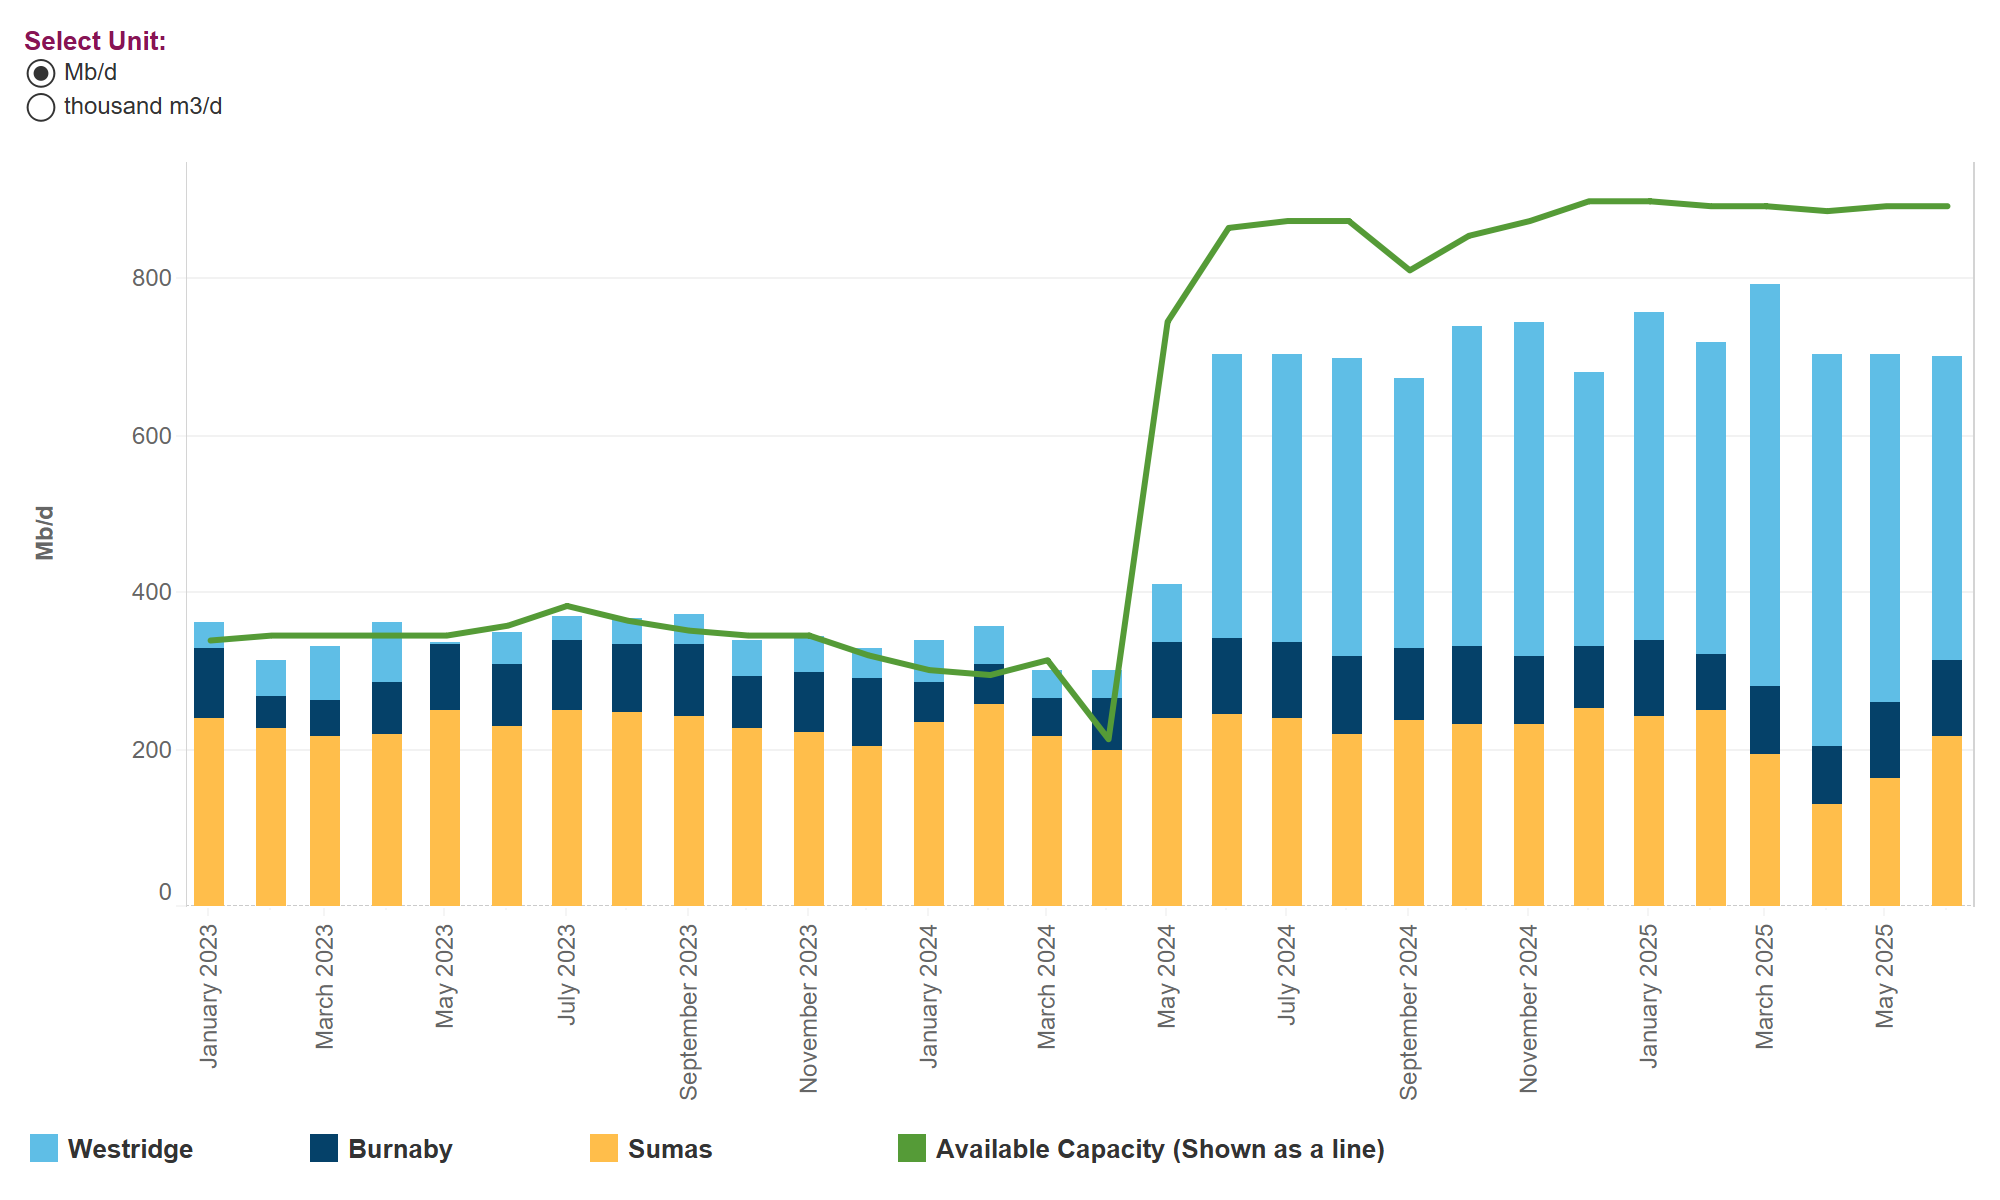
Text Alternative: This combined area and line chart shows monthly average throughput of crude oil and refined petroleum products (RPPs) and available capacity from January 2023 to June 2025 for the Trans Mountain System at Burnaby, Sumas, and Westridge delivery points. In May 2024, the TMEP came online and capacity increased. Throughputs ramped up throughout May 2024 and increased to 704 Mb/d in June 2024. Throughputs reached a high of 793 Mb/d in March 2025. The majority of the growth was driven by volumes at Westridge, while volumes at Burnaby and Sumas remained relatively steady since the expansion project came online.
At times, throughput can exceed reported available capacity because of changes that occur between the time available capacity was estimated and when shipments occur (for example, changes to the proportion of product types being transported, outages, and downstream constraints). To see an animated version of this graph, click here.

Be the first to comment