
According to the US Energy Information Administration, 2017 was the fourth consecutive year that US coal consumption and coal shipments by all transport modes declined. William Alden III photo via Wikimedia.
Electric power sector US coal consumption in 2017 was 36 per cent lower than in 2008
By Elias Johnson
This article was published by the US Energy Information Administration on Aug. 3, 2018.
The 661 million short tons (MMst) of coal consumed in the electric power sector in 2017 was the lowest amount of coal consumed since 1983, and 2017 was the fourth consecutive year that US coal consumption and coal shipments by all transport modes declined.
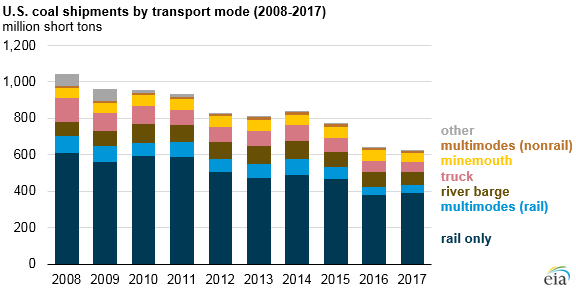
Nearly 70 per cent of the coal consumed in the power sector in 2017 was shipped either completely or in part by rail, with the remainder shipped by river barge, truck, and other methods.
Electric power sector coal consumption in 2017 was 36 per cent (376 MMst) lower than in 2008, when US coal production reached its highest level.
The amount of coal shipped by rail has similarly declined: 432 MMst of coal were shipped by rail in 2017, a slight increase from 2016 but 33 per cent lower than the 647 MMst shipped by rail in 2008.
The share of coal shipments made by river barge has increased from 7 per cent (2008) to 12 per cent (2017).
Coal produced in the Illinois Basin relies on shipments along the Ohio River and its tributaries for a significant share of its production. The share of shipments made by truck has gone from 12 per cent (2008) to 9 per cent (2017), coinciding with declines in Appalachian production that supplied generating facilities—many of which have closed or reduced their consumption of coal—that were a relatively short distance from the mines.
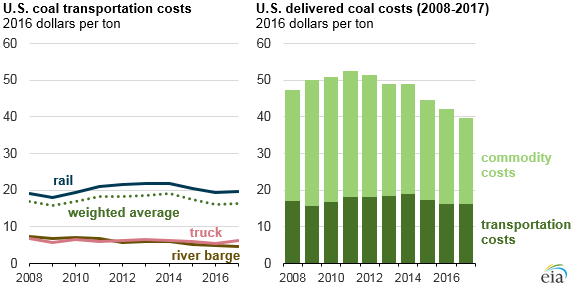
The cost of transporting coal can vary greatly along different routes. In addition to costs associated with a particular mode of transport, factors such as route length, availability of transport mode, supply source options, and the competition between coal and other commodities for transport can affect the transportation cost.
The real delivered cost of coal for all transport modes (commodity cost plus transportation cost) has fallen in recent years, most recently lower than $40 per ton in 2017, based on preliminary EIA estimates.
The real delivered cost of coal has fallen nearly $8.00 per ton (16 per cent) since 2008, with most of the reduction attributable to declining commodity costs. Over that same period, overall coal transportation costs have fallen by 4 per cent, as declines in truck (down 9 per cent) and river barge (down 39 per cent) costs more than offset a 3 per cent increase in rail shipping costs.
EIA’s updated tables average costs per ton by mode and by year on a coal basin-to-state basis and on a state-to-state basis. EIA’s updated summary of coal transportation rates through 2016 show the average real costs per ton of transporting coal from mines to power plants by mode based on data reported by plant owners and operators to EIA on the Power Plant Operations Report.
More information from EIA’s coal and electricity industry surveys is available in the interactive coal data browserand electricity data browser.

Be the first to comment