
Based on information reported to EIA in the most recent update, US refinery capacity will not expand significantly during 2018. Phillips 66 photo.
US refinery capacity has helped accommodate rising US crude production
By Kelsey Hallahan, Julie Harris
This article was published by the US Energy Information Administration on July 16, 2018.
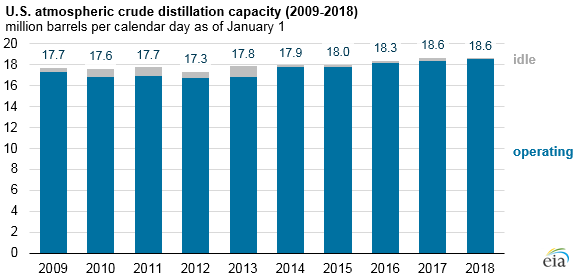
As of January 1, 2018, US operable atmospheric crude distillation capacity totalled 18.6 million barrels per calendar day (b/cd), a slight decrease of 0.1 per cent since the beginning of 2017 according to EIA’s annual Refinery Capacity Report.
Annual operable crude oil distillation unit (CDU) capacity had increased slightly in each of the five years before 2018.
US refinery capacity is measured in two ways: barrels per calendar day and barrels per stream day.
Barrels per calendar day reflect the input that a distillation unit can process in a 24-hour period under usual operating conditions, taking into account both planned and unplanned maintenance.
Barrels per stream day reflect the maximum number of barrels of input that a distillation facility can process within a 24-hour period when running at full capacity under optimal crude oil and product slate conditions with no allowance for downtime.
Stream day capacity is typically about 6 per cent higher than calendar day capacity.
The Refinery Capacity Report also includes information about secondary units—downstream refinery units that are used to process the products coming from the atmospheric crude distillation unit into ultra-low sulfur diesel and gasoline, as well as other products.
Secondary refining capacity, including thermal cracking (coking), catalytic hydrocracking, and hydrotreating and desulfurization, increased slightly, up 1 per cent from year-ago levels. These downstream capacity increases are primarily the result of changing processes that can increase refinery throughput rather than building new refining units.
The number of operating refineries decreased from 141 on January 1, 2017, to 135 on January 1, 2018, largely reflecting classification changes in EIA’s survey: four refineries previously considered separate in survey data were merged into two, and two refineries were reclassified from idle to shut down.
Consequently, the decrease in number of operating refineries does not necessarily represent a meaningful change in US refinery operating capacity.
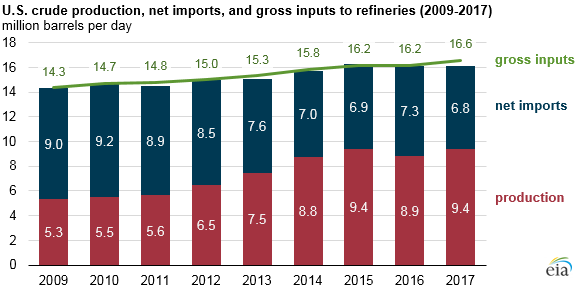
Record refinery runs have helped accommodate increases in US crude oil production, which averaged 9.4 million barrels per day (b/d) in 2017, an increase of 4.0 million b/d from the level in 2009.
Gross crude oil inputs to refineries averaged 16.6 million b/d in 2017 compared with 14.3 million b/d in 2009. Over that period, operable refinery crude distillation capacity increased 945,000 b/cd, and utilization rose from 83 per cent in 2009 to 91 per cent in 2017, resulting in the 2.3 million b/d increase in gross crude oil inputs.
Over the same period, U.S. crude oil imports decreased by 1.1 million b/d, and U.S. crude oil exports increased by 1.1 million b/d.
EIA’s Refinery Capacity Report also includes information on capacity expansions planned for the balance of the year.
Based on information reported to EIA in the most recent update, US refining capacity will not expand significantly during 2018.
Further investment in US refinery expansion projects depends on expectations about crude oil price spreads, the characteristics of the crudes being produced, product specifications, and the relative economic advantage of the US refining fleet compared with refineries in the rest of the world.

Be the first to comment