
If natural gas production continues to grow, and natural gas prices continue to fall, some producers in the Permian Basin may cease oil production to avoid producing associated natural gas. San Antonio Express News photo by Kin Man Hui.
Falling natural gas prices indicates constrained pipeline capacity
By Nicholas Skarzynski
This article was published by the United States Energy Information Administration on July 18, 2018.
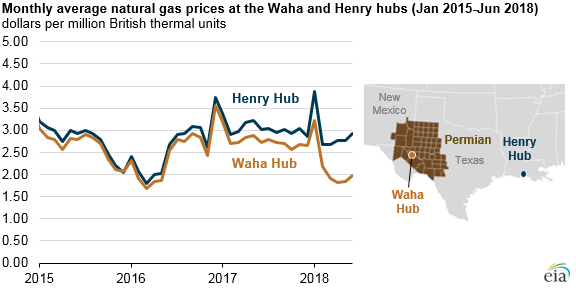
The natural gas spot price spread between the Permian Basin, as priced at the Waha Hub in western Texas, and the U.S. national benchmark Henry Hub in Louisiana has grown considerably in the past year.
Natural gas prices at Waha are nearly a dollar per million British thermal units (MMBtu) lower than Henry Hub prices. This spread widened as the ability to transport the increased natural gas production in the Permian Basin in western Texas and southeastern New Mexico was constrained by existing pipeline capacity.
Based on estimates in EIA’s most recent Drilling Productivity Report, production of natural gas in the Permian Basin averaged 10.4 billion cubic feet per day (Bcf/d) in June 2018, which was 2.1 Bcf/d more than in June 2017.
Much of this increase in production is associated natural gas, or natural gas produced as a byproduct of the increase in oil production from oil-directed rigs. As a result, the increase in natural gas production closely correlated with the increase in crude oil production in the Permian Basin, which averaged 3.3 million barrels per day (b/d) in June 2018, up 0.9 million b/d from the June 2017 level.
As Permian Basin oil production grows, producers must find outlets for the associated natural gas. Once pipeline capacity is fully used, choices are limited. The widening price differential between Waha and Henry Hub indicates pipeline capacity is already somewhat constrained.
Producers may flare or vent the natural gas, although these disposal methods are regulated in Texas and New Mexico. Both states allow flaring from wells during drilling and immediately after completion.
However, after a certain amount of time, producers can only flare natural gas after receiving exemptions from a state agency. If natural gas production continues to grow, and natural gas prices continue to fall, some producers in the area may cease oil production to avoid producing associated natural gas.
Two pipelines—Comanche Trail and Trans-Pecos—were completed in 2017 to export Permian natural gas to Mexico. Although these pipelines have a combined takeaway capacity of 2.6 Bcf/d, they are not expected to see significant flows until late 2018 or early 2019 when downstream pipeline infrastructure in Mexico enters service.
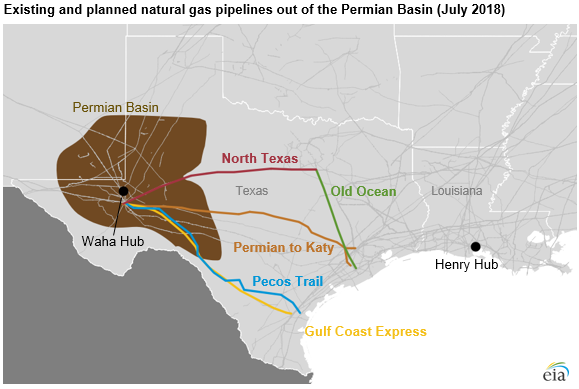
The only other project expected to come online in 2018 is the combined expansion of the North Texas Pipeline and resumption of service on the Old Ocean Pipeline, which collectively will increase pipeline capacity out of the Permian by 0.15 Bcf/d.
Several new pipelines are currently in development to carry natural gas from the Permian Basin to the Gulf Coast: the Gulf Coast Express Pipeline (2.0 Bcf/d capacity), the Permian to Katy Pipeline (1.7 to 2.3 Bcf/d capacity), and the Pecos Trail Pipeline (1.9 Bcf/d capacity).
Of these three projects, only the Gulf Coast Express is under construction, with an expected in-service date of October 2019.
The proposed pipelines from the Permian Basin are intended to meet Gulf Coast demand for natural gas, which includes new liquefied natural gas export facilities and regional industrial use.

Be the first to comment