energy graph 1
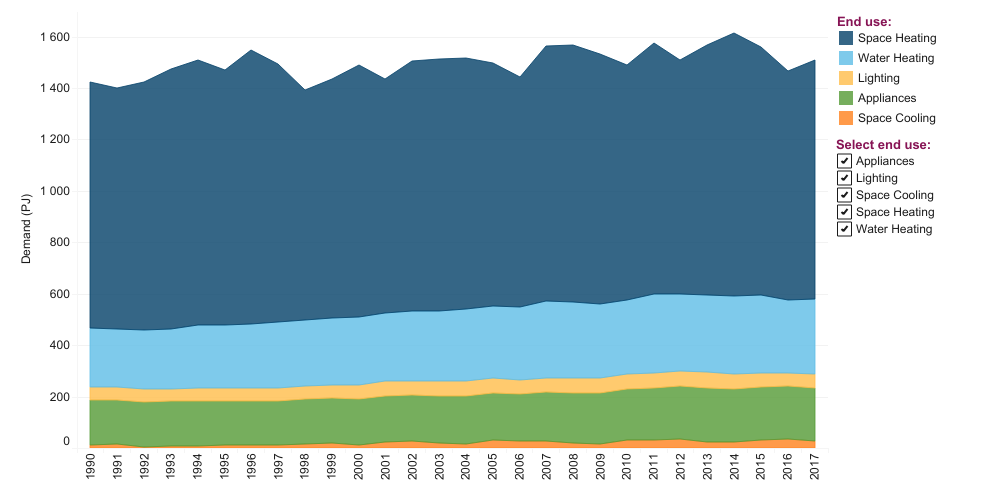
Source: Natural Resources Canada Comprehensive End-Use Database
Description: This stacked area chart shows the relative energy use by various end-uses in Canada’s residential sector between 1990 and 2017. This includes space heating, water heating, appliances, lighting, and space cooling. To see an animated version of this graph, click here.

Be the first to comment