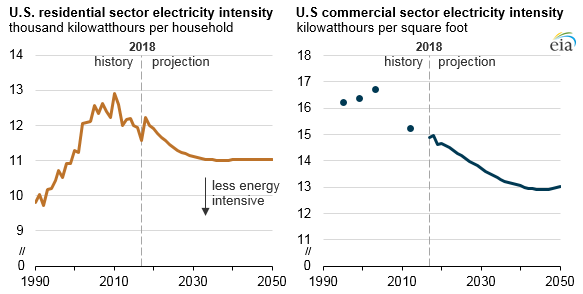
According to the US EIA, electricity intensity—the amount of electricity consumed per household or square foot of commercial floorspace—decreases by an average of 0.3 per cent per year and 0.4 per cent per year from 2018 through 2050 in the residential and commercial sectors, respectively.
Improved technology, more robust energy efficiency standards help decrease electricity intensity
By Kevin Jarzomski
This article was published by the US Energy Information Administration on Feb. 13, 2019.
In EIA’s recently released Annual Energy Outlook 2019 (AEO2019) Reference case, projected residential and commercial purchased electricity consumption grows more slowly than the number of households or total commercial floorspace.
As a result, electricity intensity—the amount of electricity consumed per household or square foot of commercial floorspace—decreases by an average of 0.3 per cent per year and 0.4 per cent per year from 2018 through 2050 in the residential and commercial sectors, respectively.
Nationally, the total number of households grows an average of 0.7 per cent per year from 2018 to 2050 in the Reference case. Total commercial floorspace grows 1.0 per cent per year during the same period. Growth rates for both sectors are higher than the expected 0.5 per cent per year increase in U.S. population.
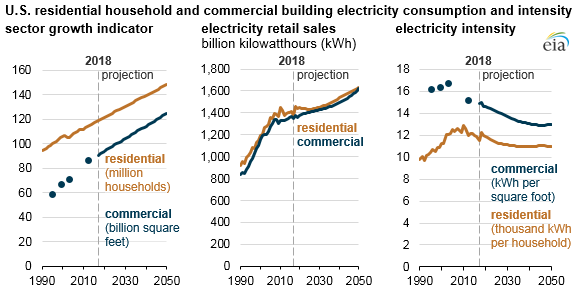
Residential electricity sales increase 0.4 per cent per year from 2018 to 2050 in the Reference case, while commercial sales increase by 0.5 per cent per year.
These projected rates are much lower than what occurred from 1990 through 2018, when electricity sales grew at average annual rates of 1.7 per cent in the residential sector and 1.8 per cent in the commercial sector. Part of this slowing growth comes from improvements in technology and energy efficiency standards.
Federal efficiency standards—first adopted in the late 1980s and in effect in the early 1990s—require minimum performance levels for space heating, cooling, and water heating equipment as well as appliances and many other energy-consuming devices in buildings.
As equipment is replaced, which can take 10 to 30 years for some equipment, overall efficiency is increased and total electricity demand is reduced from what it would have been had standards not been in place.
AEO2019 includes current federal efficiency standards that are in effect or finalized with a future effective date, so projected new and replacement equipment is expected to meet these minimum performance requirements when installed.
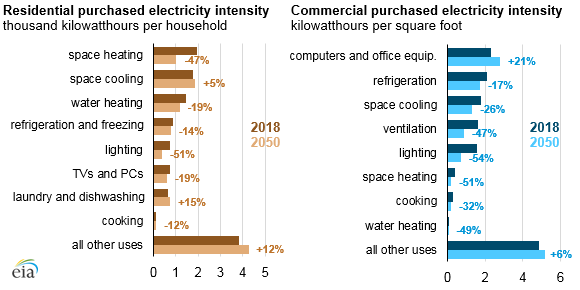
In both residential and commercial buildings, lighting exhibits the greatest per cent reduction in electricity intensity from 2018 to 2050 in the AEO2019 Reference case.
The Energy Independence and Security Act of 2007 has led consumers to replace incandescent bulbs with more efficient compact fluorescent lamps (CFLs) and light emitting diode (LED) bulbs. Over time, technology improvements and cost reductions have caused LEDs to lead sales for general service lighting.
Although energy efficiency and technology improvements increase space cooling equipment performance, EIA projects that the population will continue to shift to warmer regions of the United States and expects that warmer weather for a greater proportion of the population will tend to increase space cooling demand and reduce space heating demand.
In addition to the growing number of homes, U.S. homes are getting larger: EIA projects that the average household will have 11 per cent more conditioned floorspace in 2050 than in 2018, which generally leads to increased cooling and lighting demand per household.
The electricity intensity of other equipment, ranging from small electronic devices to large medical imaging equipment, increases as the increased adoption and market penetration of new devices and equipment outweigh the effects of efficiency improvements.
On-site electricity generation, often in the form of rooftop solar panels, continues to grow in both the residential and commercial buildings sectors in the Reference case, contributing to the slowing growth in purchased electricity.
Residential solar photovoltaic (PV) capacity increases by an average of 8 per cent annually from 2018 through 2050 in the Reference case and commercial sector PV capacity increases by an average of 5 per cent per year.
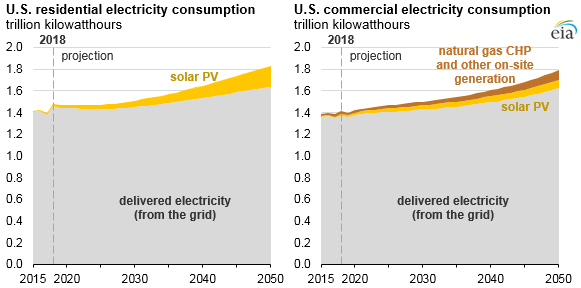
In the commercial sector, natural gas-fired combined heat and power (CHP) applications (conventional turbine, microturbine, reciprocating engine, and fuel cells) also reduce the need for purchased electricity. Overall commercial sector CHP electric generating capacity grows 5 per cent per year in the Reference case.
Be the first to comment