energy efficiency graph
Source: Natural Resources Canada, Energy Efficiency Trends Analysis Tables
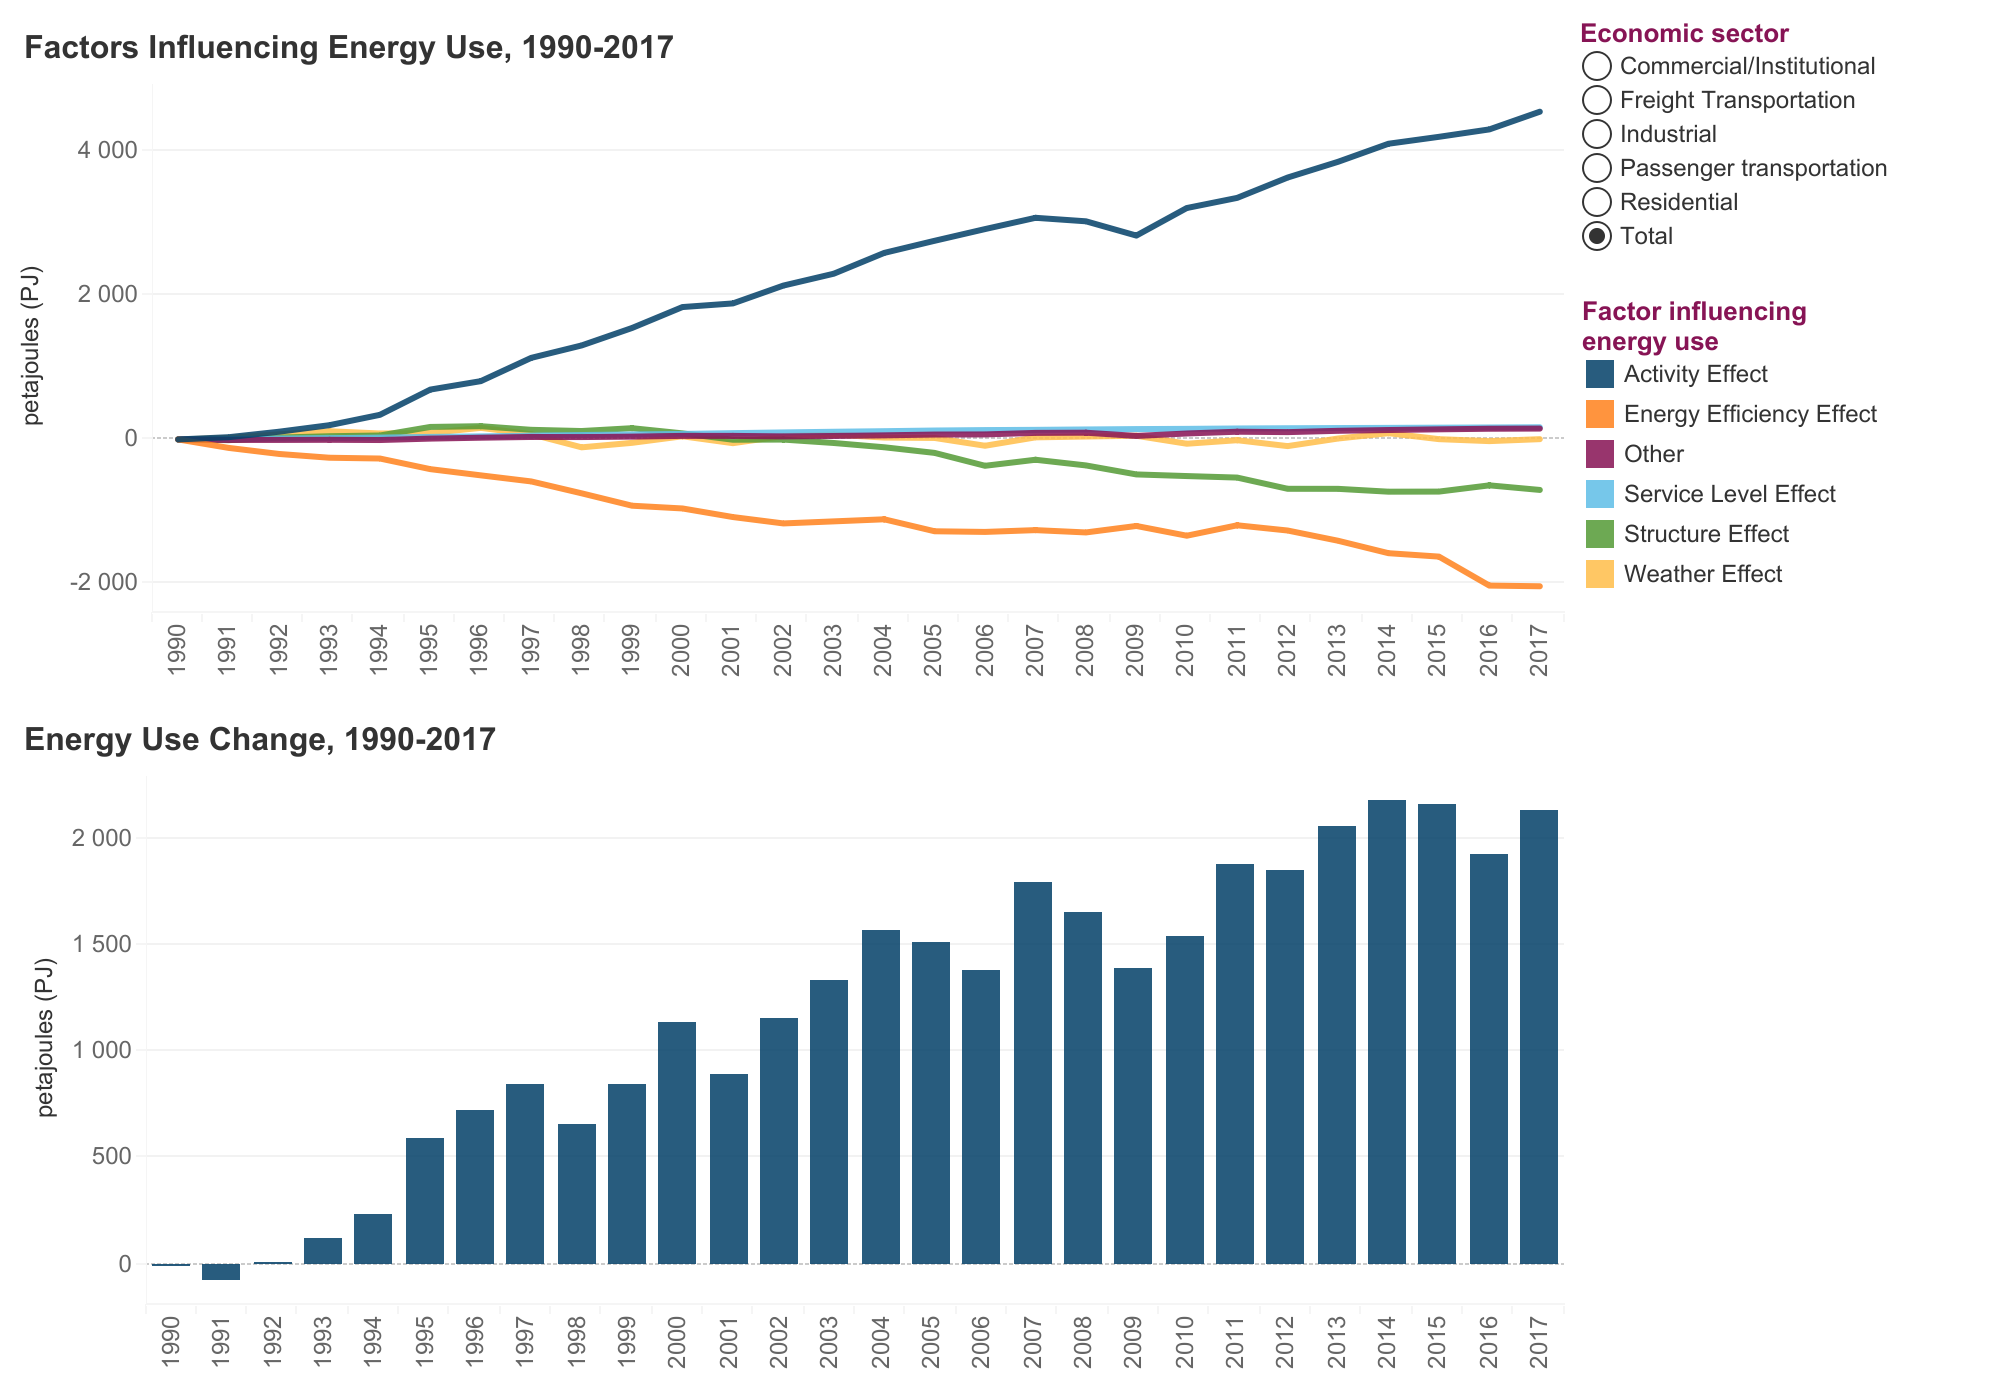
Description: This line chart breaks down national energy use into its influencing factors. It includes the weather effect, activity effect, service level effect, structure effect, energy efficiency effect, and other. The energy efficiency effect contributed the most to total energy use reduction, with an estimated 2 037 PJ. The bar chart shows the total change in energy use by economic sector, between 1990 and 2017, using 1990 as the reference year. In 2017, total energy use was 2 132 PJ higher than in 1990. The industrial sector witnessed the highest growth in energy use, increasing by 898 PJ over the same time period. The economic sector filter allows to select specific economic sectors. To see a fully animated graph, click here.

Be the first to comment