
Increase in major utilities on US electric distribution systems largely driven by increases in capital investment, which nearly doubled between 1996 and 2017.
Utilities upgrading US electric aging equipment
This article was published by the US Energy Information Administration on July 20, 2018.
By Lori Aniti
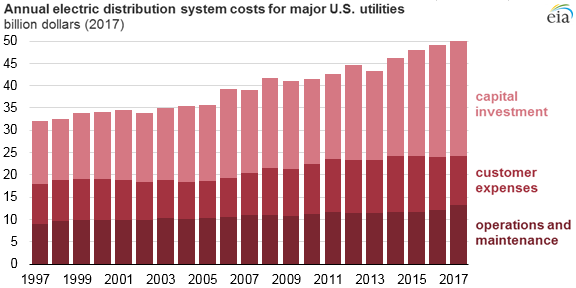
Spending on electricity distribution systems by major US electric utilities—representing about 70 per cent of total US electric load—has risen 54 per cent over the past two decades, from $31 billion to $51 billion annually.
This increase has been largely driven by increases in capital investment.
From 1996 to 2017, annual capital investment by these utilities for electric distribution systems nearly doubled, which was similar to increases in transmission investment over the same time period.
Annual spending on customer expenses and operations and maintenance by these utilities also increased slightly. This information is based on reports to the Federal Energy Regulatory Commission (FERC) from major utilities.
The electricity distribution system works to decrease voltage from high-power transmission lines and to deliver electricity to homes and businesses.
Electric distribution spending is affected by the number of customers served, the amount of electricity sold, the number of miles of electric distribution wire installed (line miles), and the maximum amount of load on the lines at one time (peak load). Electric distribution system costs have been increasing faster than the growth of any of the other variables.
Capital investment accounts for the largest share of distribution costs as utilities work to upgrade aging equipment.
According to a 2015 U.S. Department of Energy report, 70 per cent of power transformers are 25 years of age or older, 60 per cent of circuit breakers are 30 years or older, and 70 per cent of transmission lines are 25 years or older.
Poles, wires, and substation transformers are being upgraded with advanced materials and new technology to better withstand extreme weather events, to allow easier frequency and voltage control during system emergencies, and to accommodate greater use of variable renewable generation (customer-sited wind and solar).
Over the past decade, investment in overhead poles, wires, devices, and fixtures such as sensors, relays, and circuits has risen by 69 per cent, and spending on substation transformers and other station equipment has increased by 35 per cent.
Investment in customer meters has more than doubled over the past decade as utilities have upgraded customer meters to smart meters that can be accessed remotely, communicate directly to utilities, and support smart consumption and pricing applications using real-time or near real-time electricity data.
Customer-related expenses include advertising, reading meters, billing, and communicating with customers.
Although expenses related to customer accounts and sales have decreased, spending on customer services and information systems has more than doubled over the past decade in an effort to better inform customers about outage locations and durations and to develop better customer outreach tools.
Operations and maintenance (O&M) expenses have increased as electric distribution systems experience stress from several factors, including more customers, variable generation, and the effects of storms, wildfires, and flooding.
Managing a grid with increasing amounts of customer-sited variable generation increases wear and tear on the distribution equipment required to maintain voltage and frequency within acceptable limits and to manage excessive heating of transformers during reverse power flow.
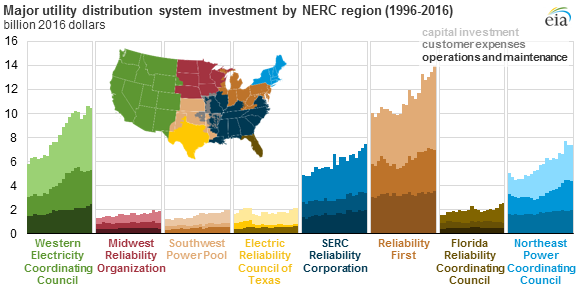
According to FERC, the largest spending increases have occurred in the older, more populated systems, which include the Northeast Power Coordinating Council (New York City and Boston), Reliability First (Chicago, Detroit, Philadelphia, Baltimore-Washington, DC), and the Western Electricity Coordinating Council (Los Angeles, San Francisco).

Be the first to comment