
According to the US Energy Information Administration, US natural gas pipeline exports to Mexico have grown from 0.9 Bcf/d in 2010 to more than 4.3 Bcf/d through April 2018.
Natural gas pipeline capacity into the South Central region of the US to reach almost 19 Bcf/d
By Katie Dyl, Jim O’Sullivan
This article was published by the US Energy Information Administration on Aug.10, 2018.
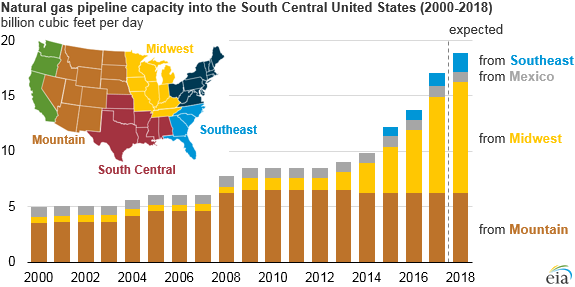
By the end of 2018, EIA expects natural gas pipeline capacity into the South Central region of the United States to reach almost 19 billion cubic feet per day (Bcf/d).
The region has shifted from being a source of natural gas supply to a source of growing demand, reversing the historical flows of natural gas in the Lower 48 states. Natural gas pipeline projects scheduled to come online in 2018 will bring additional supply to the Gulf Coast and support growing export markets.
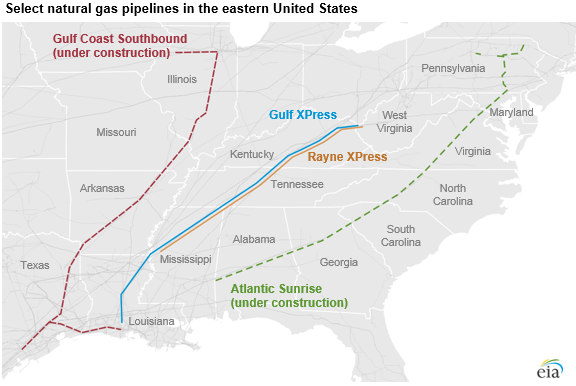
Of the additional 6.4 Bcf/d of Northeast capacity planned to come online in 2018, more than 2.8 Bcf/d reaches the South Central region directly through three projects that transport natural gas through the Midwest and Southeast: Rayne Xpress, Gulf Xpress, and Atlantic Sunrise.
Further west, Natural Gas Pipeline of America’s Gulf Coast Southbound Phase 1 is scheduled to enter service in October 2018. This pipeline will transport up to 0.46 Bcf/d of natural gas from Illinois into south Texas and Louisiana, where it will supply the Corpus Christi LNG export facility and pipelines into Mexico.
The LNG export facilities scheduled to come online in 2018 and 2019 represent an additional 6.1 Bcf/d of LNG export capacity, requiring infrastructure to connect them to the interstate pipeline network and deliver large volumes of natural gas to the liquefaction terminals.
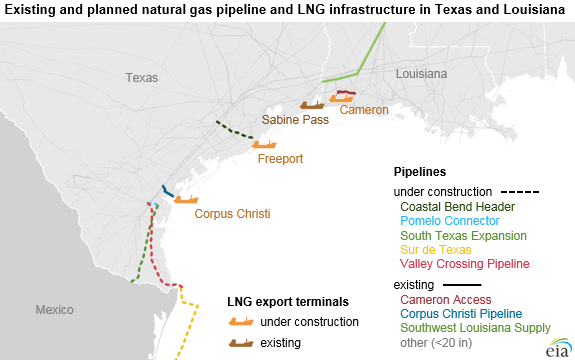
The United States currently has two operational LNG export facilities, which have a combined export capacity of 3.5 Bcf/d: Sabine Pass Trains 1-4 (2.8 Bcf/d) and Cove Point (0.8 Bcf/d).
In addition to Train 5 at Sabine Pass, four new LNG export facilities are under construction, three of which are located in the South Central region. All three of these facilities have associated pipeline projects that are scheduled to be completed this year:
- Freeport LNG will be supplied in part by the Coastal Bend Header Project (1.5 Bcf/d)
- Cameron LNG will be supplied in part by Columbia Gulf Transmission’s Cameron Access Project (0.8 Bcf/d) and Tennessee Gas Pipeline’s Southwest Louisiana Supply Project (0.9 Bcf/d)
- Corpus Christi LNG will be supplied in part by the Cheniere Corpus Christi Pipeline Project (2.25 Bcf/d)
EIA expects exports of natural gas to Mexico by pipeline to rise in 2018 as several projects within Texas are completed. U.S. natural gas pipeline exports to Mexico have grown from 0.9 Bcf/d in 2010 to more than 4.3 Bcf/d through April 2018.
Over this timeframe, pipeline capacity from Texas into Mexico has more than tripled, reaching 9.3 Bcf/d in 2017. This growth is likely to continue in 2018 with the completion of the 2.6 Bcf/d Valley Crossing Pipeline.
The complementary project under construction on the Mexican side of the border, the Sur de Texas pipeline, is an underwater pipeline along the Gulf of Mexico coast terminating in Veracruz, Mexico.
This new pipeline system will be supplied, in part, by Texas Eastern Transmission Corporation’s (TETCO) South Texas Expansion Project and Pomelo Connector Pipeline, which will increase north-to-south flow on TETCO’s system in Texas by 0.4 Bcf/d and create an interconnect between the two pipelines.
Increases in natural gas exports to Mexico depend on when the facilities on both the U.S. and Mexican side of the border begin service.
EIA is tracking the development of more than 160 proposed natural gas pipeline projects. Of these projects, 37 have been recently completed or are currently under construction and scheduled to come into service by the end of 2018.
More information is available on EIA’s Natural Gas Pipeline Projects tracker, updated quarterly, and EIA’s historical data for U.S. state-to-state pipeline capacities.

Be the first to comment