
This article was published by the US Energy Information Administration on May 13, 2022.
By Kevin Nakolan, Michael Francis
In 2021, US energy-related carbon dioxide (CO2) emissions increased by 296 million metric tons (MMmt), or 6 per cent, compared with 2020 levels. This increase followed a rise in economic activity and energy consumption once the initial economic impacts of the COVID-19 pandemic began to subside. Despite this increase in total emissions, in 2021, they were 274 MMmt (5 per cent) lower than their pre-pandemic level in 2019 and 1,143 MMmt (19 per cent) lower than their 2007 historical peak.

In 2021, the transportation and electric power sectors contributed most to rising energy-related CO2 emissions, which increased by 171 MMmt (11 per cent) and 103 MMmt (7 per cent), respectively, compared with 2020 levels. Transportation emissions rose because of increased US petroleum consumption for travel as COVID-19-related restrictions eased. Electric power sector emissions rose because of increased electricity generation and the higher carbon intensity of electricity generation. In 2021, US electric power sector emissions from coal increased for the first time since 2014.
US industrial and commercial sector energy-related CO2 emissions grew slightly, rising by 14 MMmt (1 per cent) and 8 MMmt (4 per cent), respectively, as industrial and business activity increased relative to 2020. Residential sector CO2 emissions were flat between 2020 and 2021.
At the fuel level, petroleum and coal accounted for most of US CO2 emissions increases from 2020 to 2021, rising by 181 MMmt (9 per cent) and 126 MMmt (14 per cent), respectively. The increase in petroleum emissions was largely a result of more travel demand. US jet fuel emissions increased 27 per cent, motor gasoline emissions increased 9 per cent, and emissions from distillate fuel oil (which is primarily consumed as diesel) increased 6 per cent.
Our US CO2 Emissions from Energy Consumption by Source and Sector chart provides a comprehensive view of 2021 energy-related CO2 emissions. Additional historical US monthly and annual energy-related CO2 emissions data are available in our Monthly Energy Review.
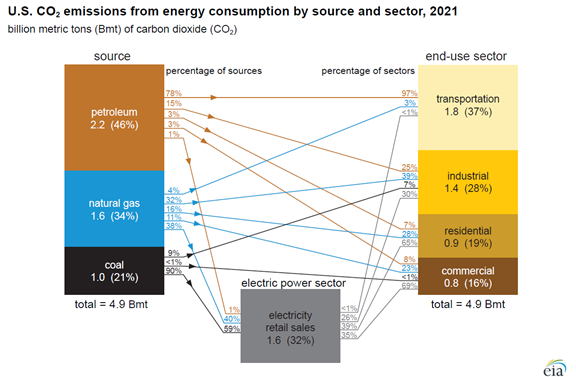
Note: Click for full U.S. CO2 emissions chart.

Be the first to comment